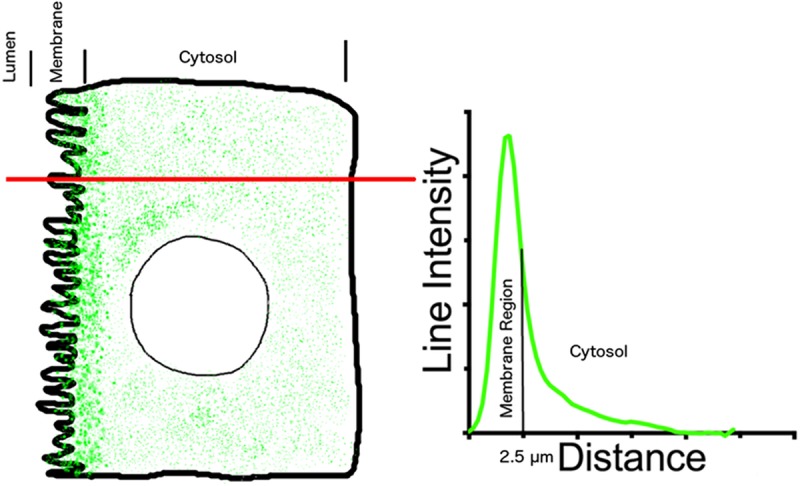
Fig 1. How we measured the line intensity and area under the curve.

A line of 0.5 μm was drawn across cells adjacent to the nucleus and pixel intensity was averaged along the line. The pixel value of the line that fell within the tubule lumen was considered as background, and the mean value from this segment of the line was subtracted from all line intensity values. The lumen-membrane junction was considered 0 distance. Total area under the curve was calculated and normalized to 100%, and percentage of area under the curve from 0 to 2.5 μm was considered as the area that included the apical membrane domain. This area calculation informs us about the fraction of total AQP2 in or near the cell membrane in a given optical section.
