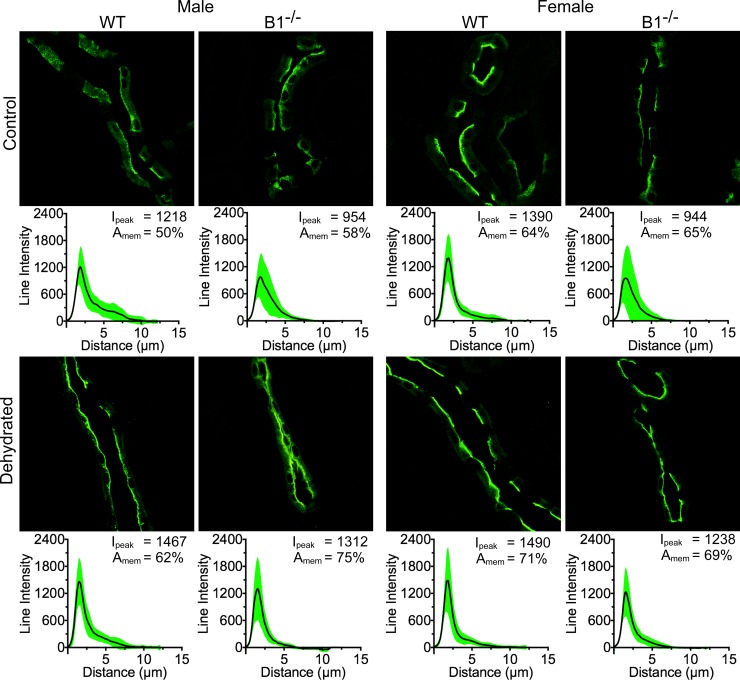
Fig 4. Male animals show the highest level of AQP2 regulation upon dehydration in the cortical collecting duct.
Immunofluorescence imaging showing the distribution of AQP2 in the kidney principal cells (PCs). Under baseline conditions, AQP2 localization in the cortical collecting duct (CCD) PCs is sex-independent in both WT and Atp6v1b1-/- (B1-/-) mice. Upon dehydration AQP2 localization partially shifted towards the apical membrane. This effect was more pronounced in the male animals, of which B1-/- mice showed the strongest response. Every panel has an average line intensity plot (black line) showing the distribution of protein within the cell. SD of the data is shown as a green area plot around the mean value plot. Peak intensity (Ipeak) values and the total intensity distribution near the plasma membrane (Amem) are also shown.

