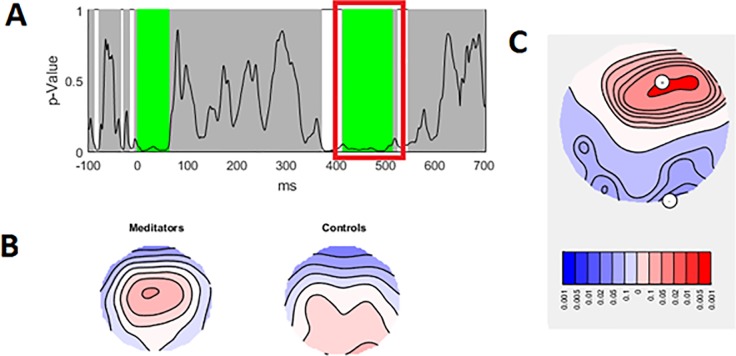
Fig 5. TANOVA main group effect from 416 to 512 ms.
A—p values of the between-group comparison for the real data against 5000 randomly shuffled permutations across the entire epoch (green periods reflect periods that exceed the duration control for multiple comparisons across time = 46 ms). B—Averaged topographical maps for each group during the significant time window. C—p-map for meditators topography minus control topography during the significant time window (p = 0.007 averaged across the significant window, partial eta squared effect size = 0.0657).

