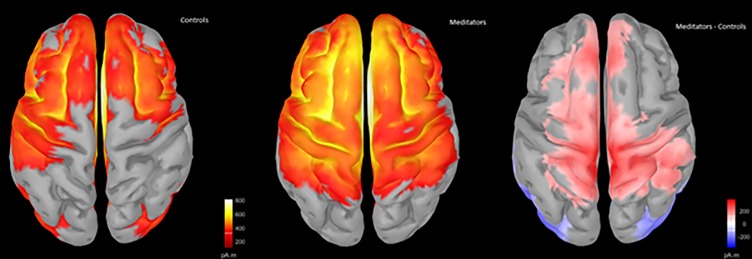
Fig 9. Source reconstruction during the 416 to 512 ms window using sLORETA and minimum norm imaging, unconstrained to cortex (to minimise assumptions).
Group averages do not depict positive or negative voltages, only where a region was activated. Difference maps reflect meditator minus control activity (red reflecting more activity in meditators compared to controls, blue reflecting less activity in meditators).

