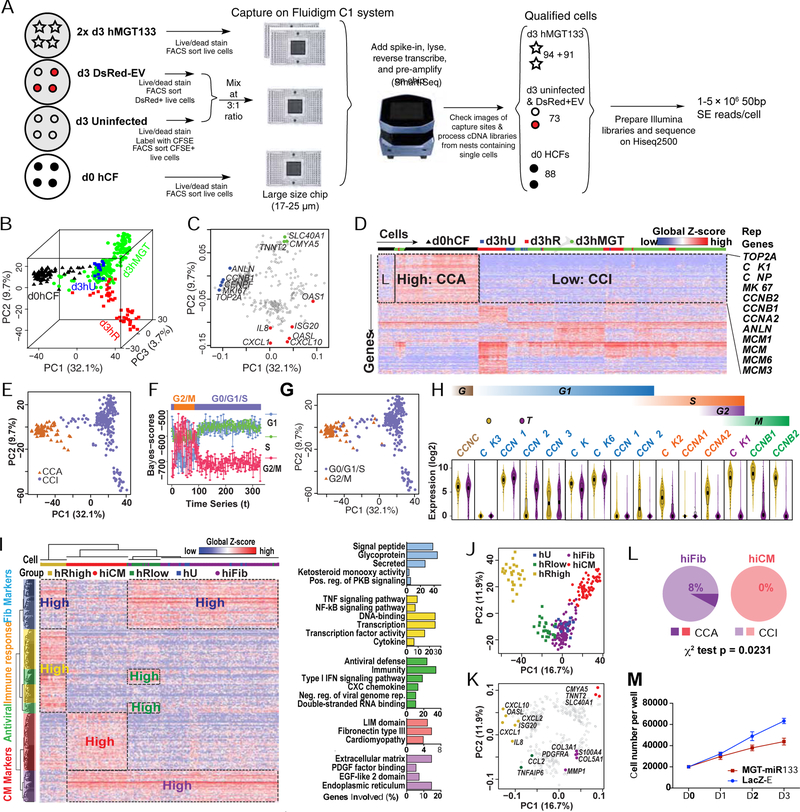
Figure 2. scRNA-seq on day 3 reprogramming hCFs revealed the cell cycle status during hiCM induction.
(A) Schematic of experimental design for scRNA-seq (see details in Methods).
(B, C) 3D PCA score plot (B) and 2D loading plot (C) calculated with the top 400 genes in all single cells.
(D) Heatmap showing identification of a cell-cycle related gene cluster by HC of all single cells with top 400 PCA genes. CCA, cell-cycle active. CCI, cell-cycle inactive. Rep Genes, representative genes.
(E) PCA of all single cells color-coded by CCA/CCI state.
(F) Each dot represents a cell and the cell cycle status of each cell was determined based on its mean score calculated by reCAT.
(G) PCA of all single cells color-coded by cell-cycle states from (F).
(H) Violin plot showing the distribution of expression of cyclin and cyclin-dependent kinases in d0hCF cells and the rest single cells. Box plots were overlaid.
(I-K) HC and PCA of day 3 control and reprogramming cells were calculated with top 400 PCA genes. (I) Heatmap showing HC results and relevant GO terms. Pos., positive; reg., regulation; neg., negative; rep., replication. PCA score (J) and loading (K) plots showing the five cell groups identified by HC.
(L) Comparison of the CCA:CCI ratio in hiFib and hiCMs.
(M) Cell number count of hMGT133 or LacZ-EV infected hCF along first 3 days after infection. Error bars indicate mean ± SEM, N= 3 in (M), *p < 0.05. See also Figures S1, S2 and Table S1.

