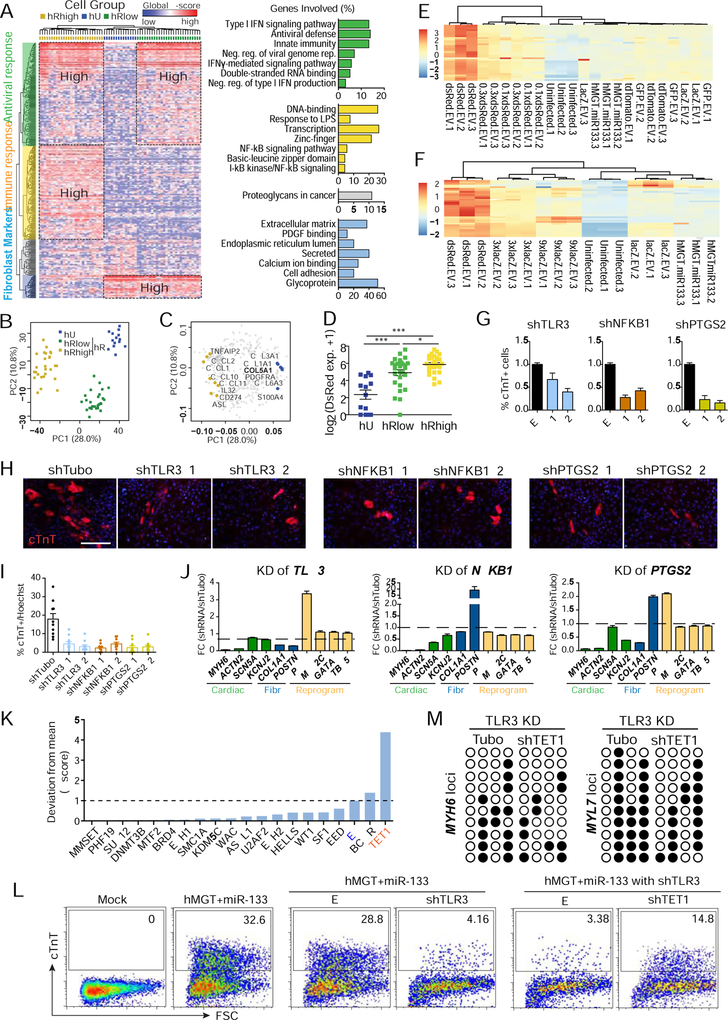
Figure 3. Activation of innate immunity is required for hiCM generation.
(A-C) HC and PCA of d3hU and d3hR cells were calculated with top 400 PCA genes. (A) Heatmap showing HC-identified clusters (left) and GO terms (right). Neg., negative; reg., regulation. PCA score (B) and loading (C) plot showing the three cell groups identified by HC. (D) Expression levels of DsRed in the three cell groups. *, p < 0.05; ***, p < 0.001.
(E-F) Heatmap of the relative expression of immune-related genes determined by RT-qPCR in hCF 3 days after infection of hMGT133 together with indicated control viruses. Less amount of DsRed led to reduced immune response (E). Overdose of LacZ showed over activation of immune genes (F).
(G-I) Flow cytometry (G), immunostaining images (H) and quantification (I) of cTnT+ cells 14 days post-coinfection of hMGT133 and indicated shRNAs. EV, empty vector; shTubo,control. #1 and #2 are two individual shRNA oligos of each gene.
(J) RT-qPCR of marker gene expression at day 14 after knockdown of the indicated genes in hiCMs. Fibr, fibroblast genes.
(K) Histogram of normalized Z score of % cTnT+ cells after infection of shRNA lentiviruses targeting epigenetic regulators in TLR3 depleted hiCMs.
(L) Flow cytometry for cTnT+ hiCMs in TLR3 knockdown cells and TLR3/TET1 double knockdown cells.
(M) Bisulfite sequencing results showing DNA methylation at MYH6 and MYL7 loci. Open circle, unmethylated CpGs; closed circle, methylated CpGs.
Error bars indicate mean ± SEM, N=10 in (I), N= 3 in (G and J), **p < 0.01. See also Figure S3 and Table S2.

