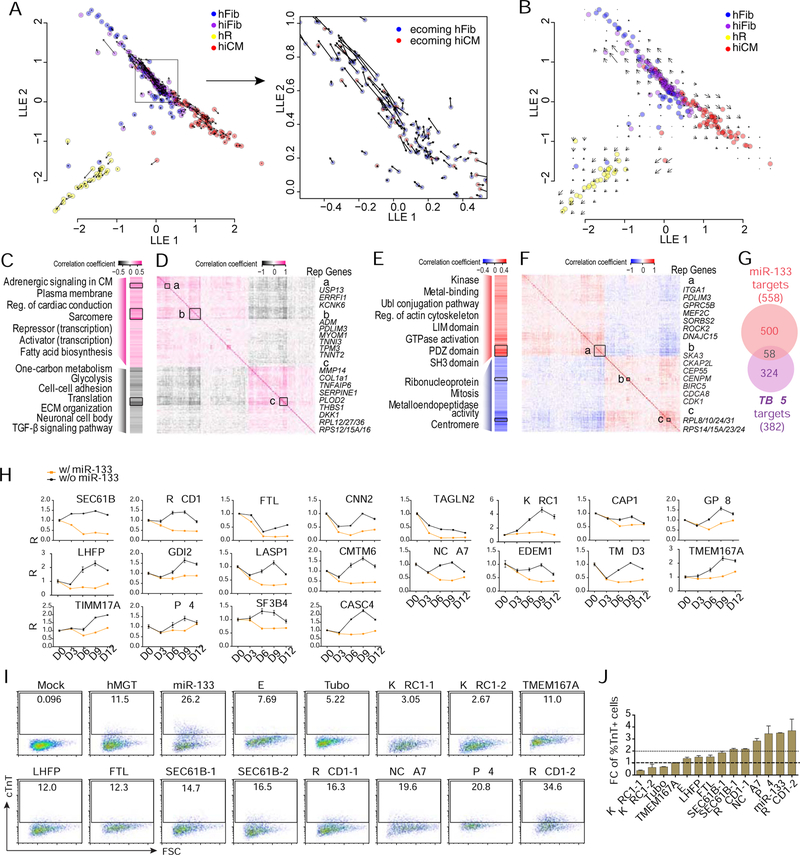
Figure 4. Identification of cell fate decision point by RNA velocity and downstream gene networks regulated by reprogramming factors.
(A, B) Vector field of RNA velocity projected onto the SLICER trajectory. Arrows indicate the direction and “speed” for each cell (A) or the average velocity at a grid of points (B) along the trajectory.
(C-G) Potential TBX5 and miR-133 target genes whose expression significantly correlated (P < 0.05) to TBX5 (C, D) or miR-133 (E, F) expression. (C, E) Heatmaps showing Pearson correlation coefficient and representative GO terms enriched in positively- or negatively-correlated target genes. Genes were ordered the same as (D) and (F). Reg., regulation; ECM, extracellular matrix. (D, F) Heatmaps showing inter-correlation of TBX5 (D) or miR-133 (F) target genes with co-expressed genes highlighted with boxes a-c. Genes were ordered by hierarchical clustering. Representative (rep.) genes in each box are listed to the right of the heatmap. (G) Venn diagram showing the number of target genes significantly correlated with miR-133 (red) or TBX5 (purple) expression.
(H) Time course analysis of relative expression of miR-133 candidate targets in hMGT-infected or hMGT133 infected hCFs. Expression value of each gene in D0 cells was set as 1.
(I-J) Flow cytometry plots (I) and quantification (J) showing % cTnT+ cells in hMGT-infected hCFs with addition of indicated shRNA to replace miR-133 for reprogramming.
Error bars indicate mean ± SEM, N= 3 in (H and J). See also Figure S4 and Table S2.

