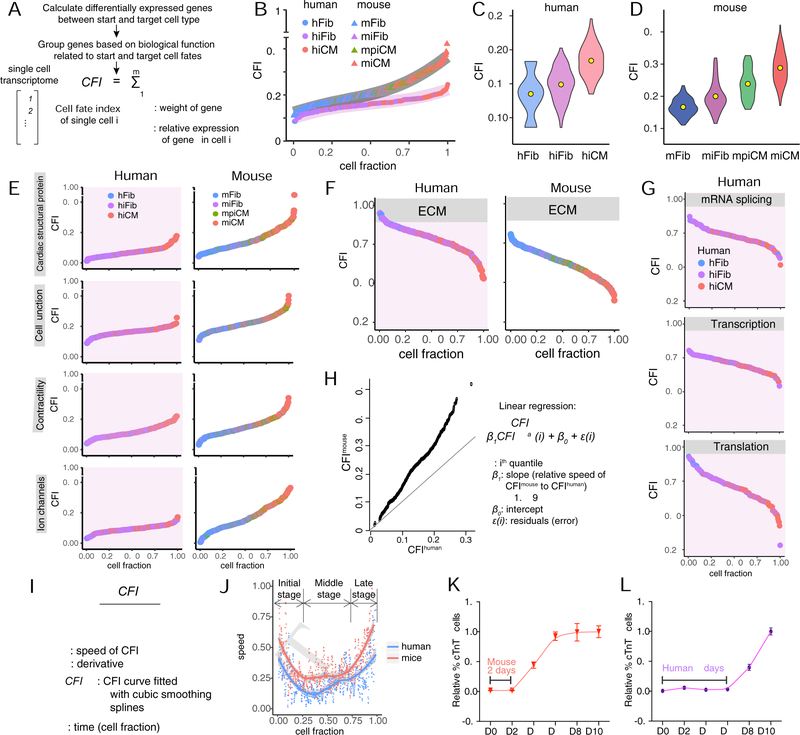
Figure 5. Quantitative assessment of mouse and human iCM progression.
(A) Schematic for the calculation of cell fate index (CFI). See Methods for details.
(B-D) CFIs of day 3 mouse and human single cells undergoing reprogramming. (B) Overall CFIs calculated with cardiac fate- and function-related genes. Trendlines were show in grey (mouse) and lavender (human). Violin plots showing distribution of CFI in subpopulations of cells during hiCM (C) or miCM (D) reprogramming. Center yellow dots indicate the median value. mpiCM, mouse pre-iCM.
(E-G) CFIs calculated with subgroups of cardiac genes (E) or starting cell fate-related genes (F, G). ECM, extracellular matrix.
(H) Quantile-quantile plot of mouse and human CFIs shown in (B). The solid line indicates hypothetical data if speed of mouse equals to speed of human.
(I) Formula for calculating instantaneous speed of reprogramming. See Figure S5G and S5H for details about CFIcubic.
(J) Speed of hiCM and miCM reprogramming calculated based on (I). Trendline was calculated by fitting cubic smoothing spline and confidence bands were shown in grey. Two-sided t tests were performed, α= 0.05.
(K, L) Kinetics of miCM (K) and hiCM (L) reprogramming plotted by relative percentage of marker positive cells determined by flow cytometry along reprogramming. The end point of reprogramming was set as 1.
Error bars indicate mean ± SEM, N=3. See also Figure S5 and Table S3

