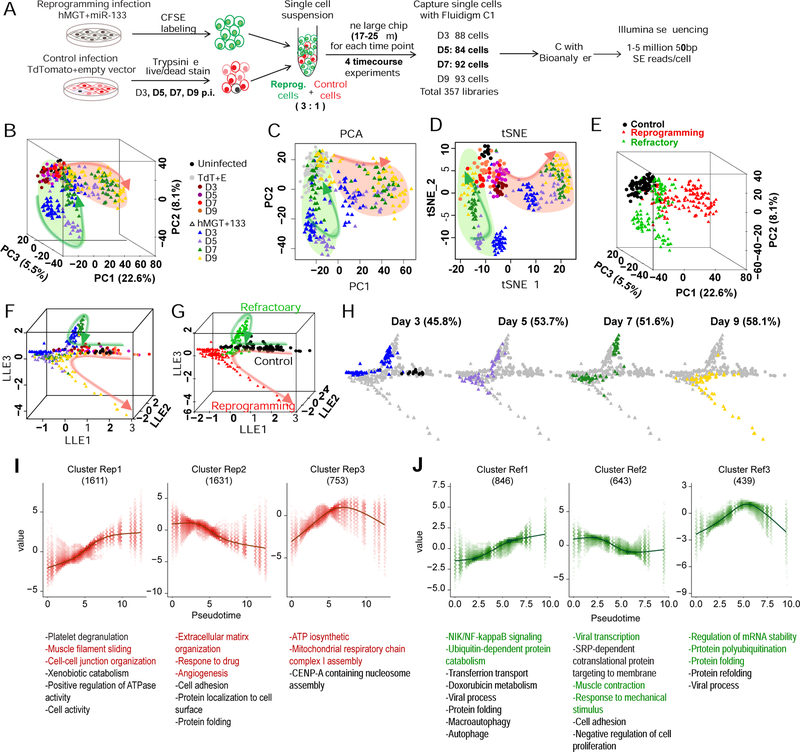
Figure 6. Time-course scRNA-seq of hiCM reprogramming identified a refractory route.
(A) Schematic of experimental design for time-course scRNA-seq of hiCM reprogramming (see details in Methods).
(B-E) PCA and tSNE of control and reprogramming cells from day 0, 3, 5, 7, and 9 were calculated with top 400 PCA genes. Cells were color-coded by treatment (B-D) or clusters defined by HC (E) and shown in 3D PCA (B, E), 2D PCA (C), or tSNE (D) plots.
(F-H) Reprogramming trajectories constructed by SLICER shown in 3D with cells color-coded by treatment as indicated in (B) (F and H) or HC clusters (G). (H) Cells at each time point were highlighted by coloring cells from other time points in gray.
(I-J) Six gene clusters that are significantly related to and show similar trends along the reprogramming (Rep) (I) or refractory (Ref) (J) trajectory were identified. GO analysis was performed for each gene cluster and listed in the bottom. The number of genes in each cluster is shown in parentheses.

