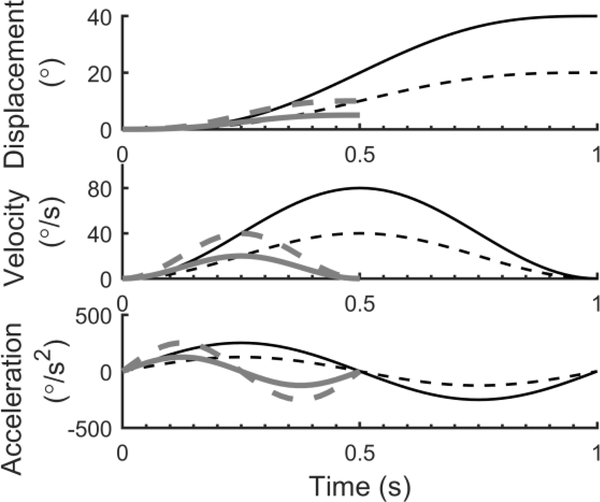
Figure 2:
Displacement, velocity and acceleration for the 4 motion conditions used. Each was a single sinusoidal cycle of acceleration, with the frequency and amplitude adjusted to change the relationship between displacement, velocity and acceleration. 1 Hz motions (black) lasted 1 s and had a peak velocity of 80°/s (solid black line) or 40°/s (dashed black line). 2 Hz motions (grey) lasted 0.5 s and had a peak velocity of 40°/s (dashed grey line) or 20°/s (solid grey line).

