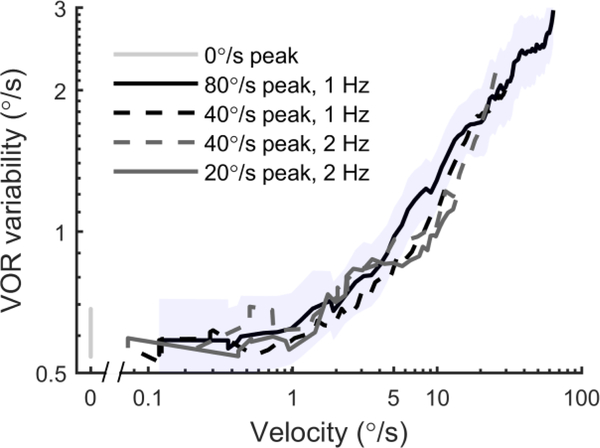
Figure 4:
The dependency of VOR variability on chair velocity. Each line shows VOR variability averaged across 6 subjects using the geometric mean, plotted as a function of chair velocity. They show that VOR variability increased with chair velocity. Furthermore, the relationship between VOR variability and chair velocity was similar for four different conditions despite them having different displacements and accelerations. The shading shows the standard error across subjects for the 80°/s condition.

