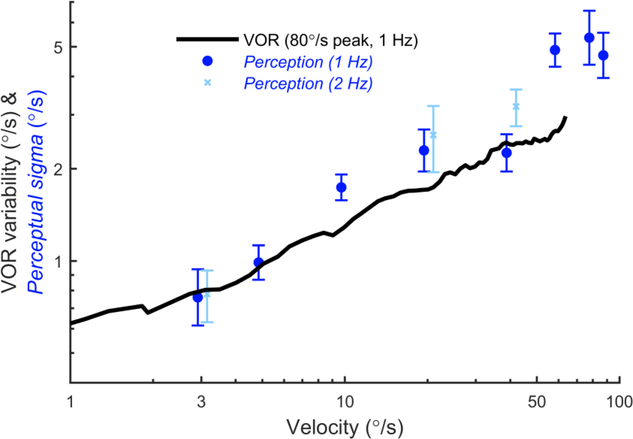
Figure 8:
Perceptual sigma and VOR variability have a similar dependency on velocity. For perceptual measurements, the x-axis is the peak velocity of the reference motion, while for VOR measurements it is the instantaneous chair velocity. Each symbol indicates the mean perceptual sigma across subjects for one reference peak velocity, calculated using the geometric mean. The error bars indicate standard error. The black line shows average VOR variability from the same subjects in response to stimuli with a peak velocity of 80°/s.

