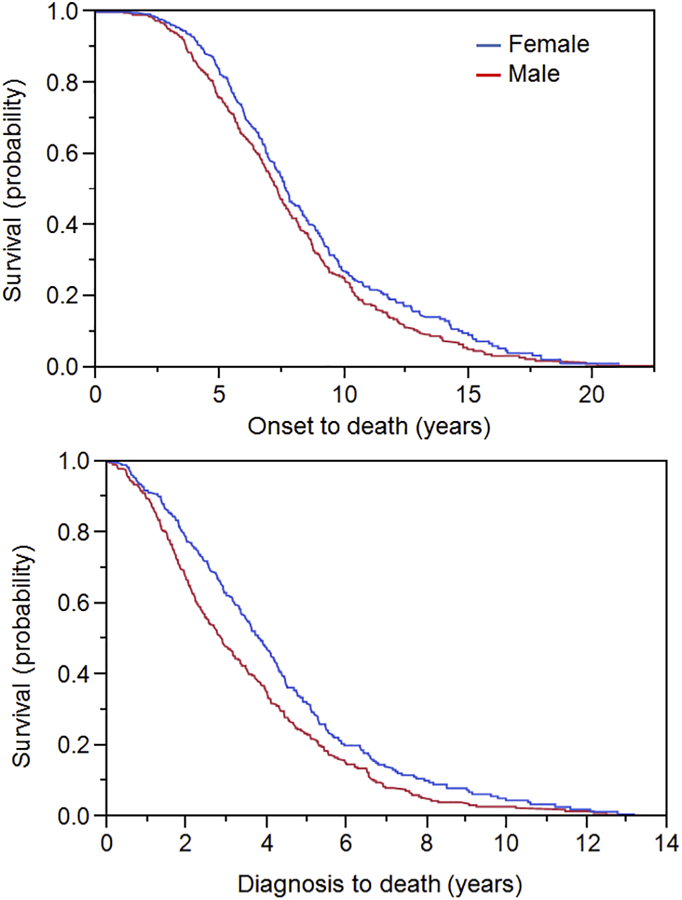
Figure. Survival curves for female and male MSA patients.

Censored Kaplan-Meier survival curves for female (blue) and male (red) MSA patients showing probability of death from symptom onset (top) and probability of death from time of diagnosis (bottom).
