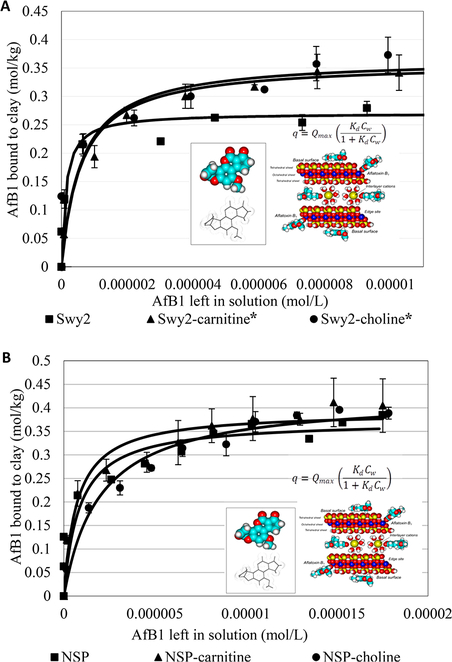
Figure 4.
Langmuir plots of AfB1 on Swy2 (A) and NSP (B) showing the observed and predicted Qmax values at pH 6.5. The Qmax values indicated tight binding for all three sorbents. Swy2, Qmax = 0.27; Kd = 7E6. Swy2-carnitine: Qmax = 0.36; Kd = 2E6. Swy2-choline: Qmax = 0.367; Kd = 2E6. AfB1 left in solution (mol/L) NSP: Qmax= 0.37; Kd = 1E6. NSP-carnitine: Qmax = 0.39; Kd = 1.4E6. NSP-choline: Qmax = 0.42; Kd = 5E5.

