Fig. 1.
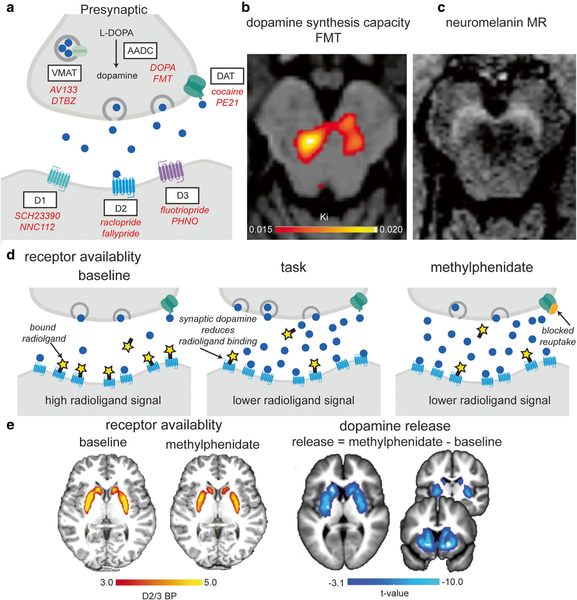
In vivo measurement of the dopamine system. a PET tracers target pre and postsynaptic components of dopamine function. Presynaptic targets include the vesicular monoamine transporter (VMAT), the dopamine synthesis enzyme aromatic amino acid decarboxylase (AADC), and the dopamine transporter (DAT). Postsynaptic targets include D1, D2, and D3 dopamine receptors. Examples of PET tracers for each of these targets are in red italics. b Fluoro-l-m-tyrosine (FMT) PET image overlaid on a T1-weighted structural image displays dopamine synthesis capacity for a single subject in the midbrain. c Neuromelanin-sensitive MR image displays neuromelanin rich regions in white. This single subject image was acquired at UC Berkeley using a 3D T1-weighted multiecho Fast Low Angle Shot (FLASH) sequence on a 3T Siemens TIM/Trio and displays substantia nigra signal in the midbrain. d Dopamine release can be measured within-subject by comparing baseline dopamine receptor availability with receptor availability following task-performance or drug administration. At baseline, when endogenous levels of dopamine (blue dots) are low, the PET radioligand (yellow stars) competitively binds to dopamine receptors. This competitive binding is reduced when synaptic dopamine increases via release (center) or via blockade of the transporter following methylphenidate administration (right). (E) Two [11C]raclopride scans are displayed for a single subject at baseline (placebo) and following oral methylphenidate administration. Reductions in nondisplaceable binding potential (BPND) are evident throughout striatum for the single subject and on the group level (n = 40, adapted from Berry, Shah, Furman, et al., 2018) and represent dopamine release. (Color figure online)

