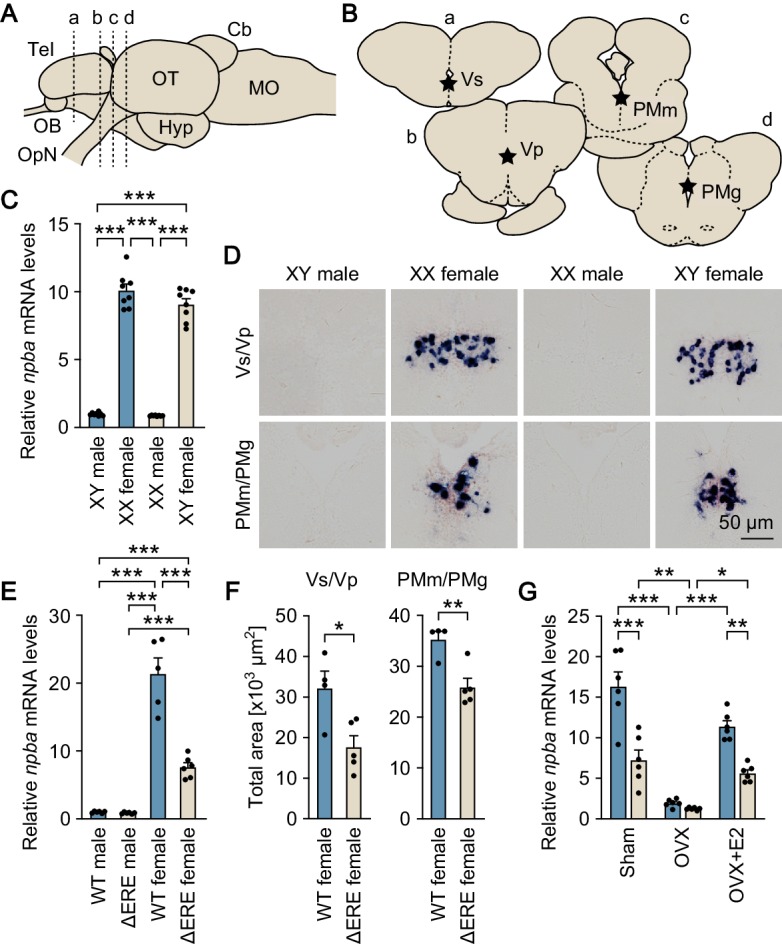
Figure 1. Sexually dimorphic npba expression is independent of sex chromosome complement but dependent on direct transcriptional activation by estrogen.
(A) Lateral view (anterior to left) of the medaka brain showing approximate levels of sections in panel B. For abbreviations of brain regions, see Supplementary file 1. (B) Coronal sections showing the location of Vs/Vp and PMm/PMg. (C) Levels of npba expression in the whole brain of artificially sex-reversed XX males/XY females, and wild-type XY males/XX females as determined by real-time PCR (n = 8 per group). ***, p<0.001 (Bonferroni’s post hoc test). (D) Representative micrographs of npba expression in Vs/Vp and PMm/PMg of sex-reversed XX males/XY females and wild-type XY males/XX females (n = 5 per group). Scale bars represent 50 μm. (E) Levels of npba expression in the whole brain of male and female mutants lacking the estrogen-responsive element in the npba promoter (ΔERE), and wild-type (WT) males and females as determined by real-time PCR (n = 6 per group, except WT females, where n = 5). ***, p<0.001 (Bonferroni’s post hoc test). (F) Total area of npba expression in Vs/Vp and PMm/PMg of ΔERE (n = 5) and WT (n = 4) females. *, p<0.05; **, p<0.01 (unpaired t-test). (G) Levels of npba expression in the whole brain of ΔERE (beige columns) and WT (blue columns) females that were sham-operated (Sham), ovariectomized (OVX), or ovariectomized and treated with estradiol-17β (OVX +E2) as determined by real-time PCR (n = 6 per group). There were significant main effects of genotype (F (1, 30)=45.03, p<0.0001) and treatment (F (2, 30)=60.19, p<0.0001) and a significant interaction between genotype and treatment (F (2, 30)=9.944, p=0.0005). *, p<0.05; **, p<0.01; ***, p<0.001 (Bonferroni’s post hoc test). See also Figure 1—figure supplement 1 and Figure 1—figure supplement 2.

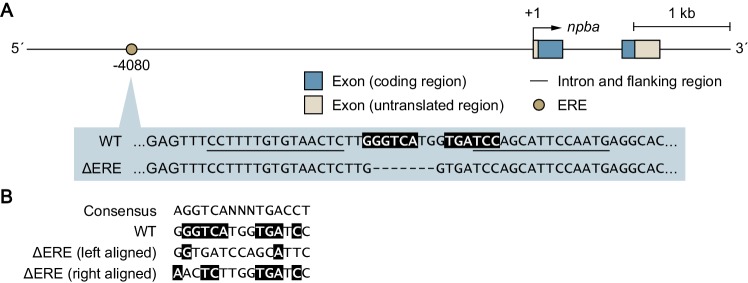
Figure 1—figure supplement 1. Genetic scheme for the ΔERE mutant medaka.
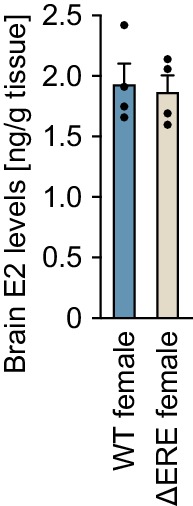
Figure 1—figure supplement 2. Levels of estradiol-17β (E2) in the brains of ∆ERE mutant and wild-type (WT) females.


