. 2019 Aug 6;8:e39495. doi: 10.7554/eLife.39495

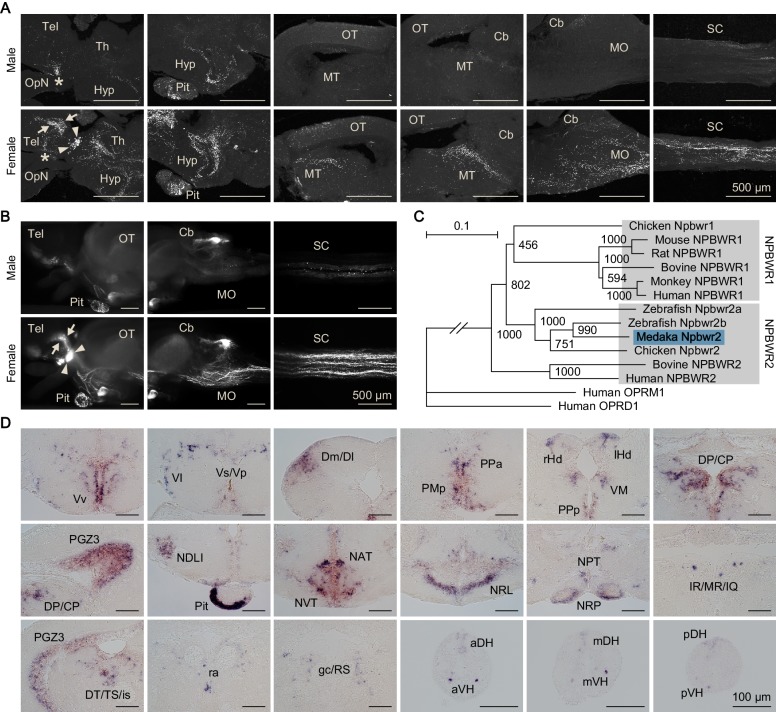
Figure 3. Female-specific Npba likely acts widely in the brain and spinal cord.

(A) Comparison of the distribution of Npba-immunoreactive axons in the brain, pituitary, and spinal cord between males and females. All images are sagittal sections with anterior to the left. Arrows and arrowheads indicate female-specific Npba-immunoreactive neuronal cell bodies in Vs/Vp and PMm/PMg, respectively. Asterisks indicate Npba-immunoreactive neuronal cell bodies in Pbl occurring in both sexes. Scale bars represent 500 μm. For abbreviations of brain regions, see Supplementary file 1. (B) Comparison of the distribution of GFP-labeled axons in the brain, pituitary, and spinal cord between npba-GFP transgenic males and females. Images in the left and middle panels are lateral views with anterior to the left; images in the right panels are horizontal views with anterior to the left. Arrows and arrowheads indicate female-specific GFP-labeled neuronal cell bodies in Vs/Vp and PMm/PMg, respectively. Scale bars represent 500 μm. (C) Phylogenetic tree of NPBWR1 and NPBWR2. The number at each node indicates bootstrap values for 1000 replicates. Human opioid receptors μ1 (OPRM1) and δ1 (OPRD1) were used as the outgroup for tree reconstruction. Scale bar represents 0.1 substitution per site. For species names and GenBank accession numbers, see Supplementary file 3. (D) Distribution of npbwr2 expression in the brain, pituitary, and spinal cord. All images are coronal sections. Images of only males are presented, because there were no obvious sex differences in the distribution of expression (n = 5 per sex). Scale bars represent 100 μm. For abbreviations of brain and spinal cord regions and brain nuclei, see Supplementary file 1. See also Figure 3—figure supplement 1, Figure 3—figure supplement 2, Figure 3—figure supplement 3, and Figure 3—figure supplement 4.

Figure 3.

Figure 3—figure supplement 1. Verification of the specificity of the anti-Npba antibody.
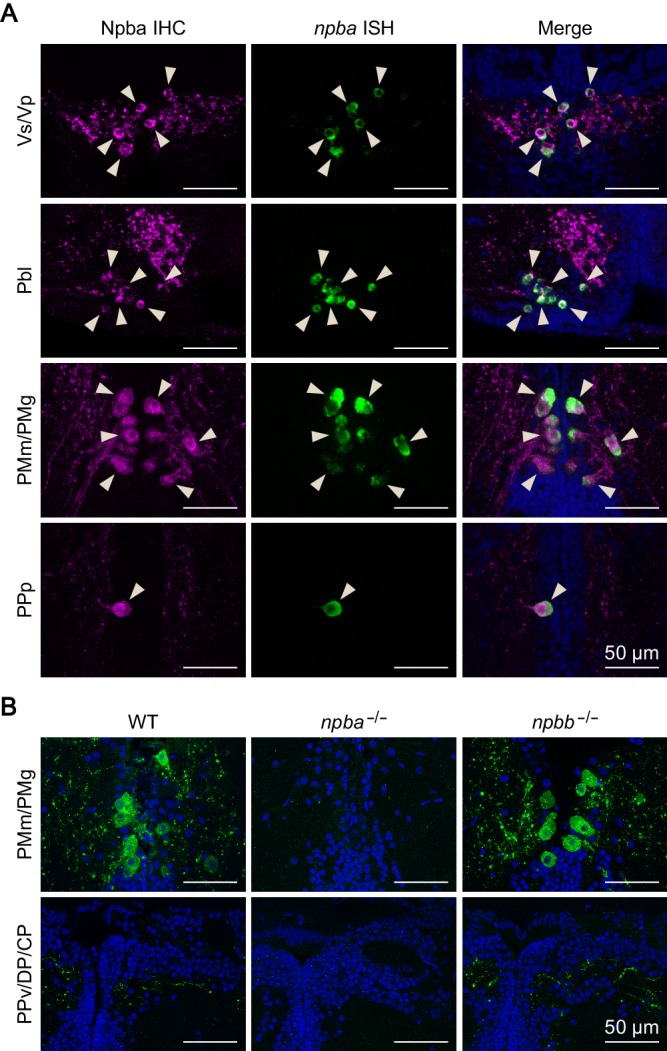
Figure 3—figure supplement 1.

(A) The specificity of the anti-Npba antibody was verified by a pattern of labeling consistent with npba-expressing neurons detected by in situ hybridization in the medaka brain. Left and middle panels show images of immunohistochemistry (IHC) using the anti-Npba antibody (green) and in situ hybridization (ISH) detecting npba expression (magenta), respectively, in the same sections; right panels show the merged images with nuclear counterstaining (blue). Arrowheads indicate representative neuronal cell bodies labeled by both IHC and ISH. The IHC signals that do not overlap with the ISH signals most likely represent the axons of Npba-expressing neurons (but not the cell bodies of other neurons), given their relatively small size and typical varicosity-like structures. Scale bars represent 50 μm. (B) The lack of cross-reactivity of the anti-Npba antibody with Npbb was confirmed by the observation that labeled cell bodies and axons (green) were present in npbb knockout (npbb-/-) as well as wild-type (WT) females, npbb-/- but totally absent in npba knockout (npba-/-) females (n = 15, 9, and eight for wild-type, npba-/-, and npbb-/- females). Representative micrographs of PMm/PMg, which contains neurons expressing both npba and npbb, and PPv/DP/CP, which contains hundreds of npbb-expressing neurons but no npba-expressing neurons, are shown. Scale bars represent 50 μm. For abbreviations of brain nuclei, see Supplementary file 1.
Figure 3—figure supplement 2. Generation and verification of npba-GFP transgenic medaka.
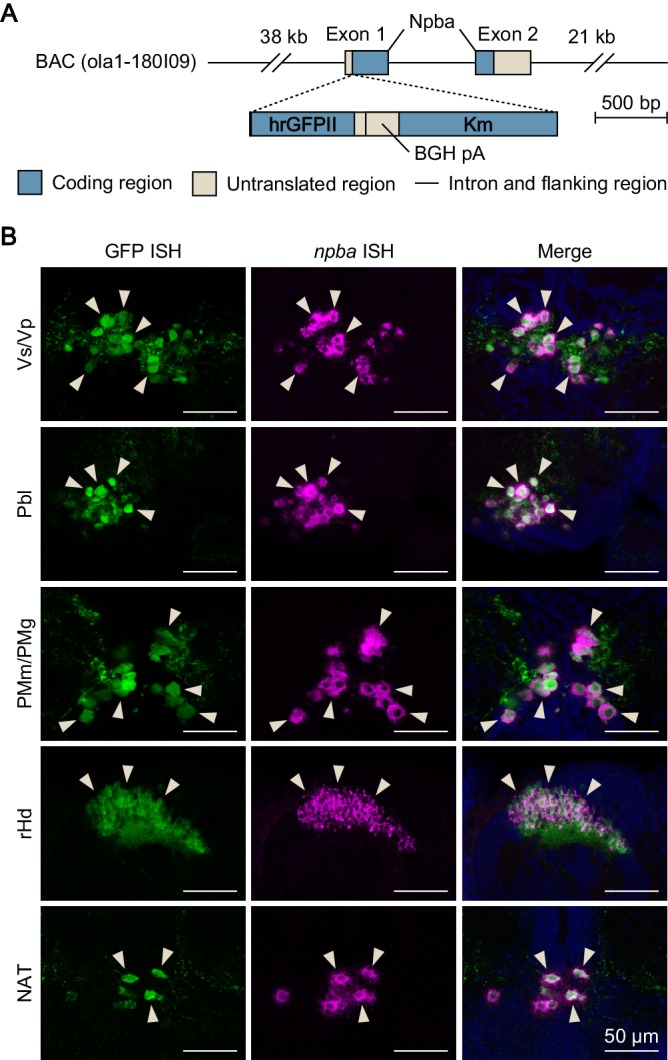
Figure 3—figure supplement 2.

(A) Structure of the transgene in npba-GFP transgenic medaka. A 22 bp sequence containing the translation initiation site of npba in a medaka bacterial artificial chromosome (BAC) clone (clone ID: 180_I09) was replaced by a 2136 bp DNA cassette containing the humanized Renilla reniformis GFP II (hrGFPII)-coding sequence, bovine growth hormone polyadenylation signal (BGH pA), and kanamycin resistance gene (Km). This BAC clone contains the whole transcriptional unit of npba together with 38 kb of 5′-flanking and 21 kb of 3′-flanking sequence. (B) The specificity of GFP expression was verified by double in situ hybridization (ISH) of GFP and npba in the brain of npba-GFP transgenic medaka. Left and middle panels show images of GFP (green) and npba expression (magenta), respectively, in the same sections; right panels show the merged images with nuclear counterstaining (blue). Note that GFP fluorescence remained visible after processing for ISH. Arrowheads indicate representative neuronal cell bodies labeled by both GFP and npba ISH. Scale bars represent 50 μm. For abbreviations of brain nuclei, see Supplementary file 1.
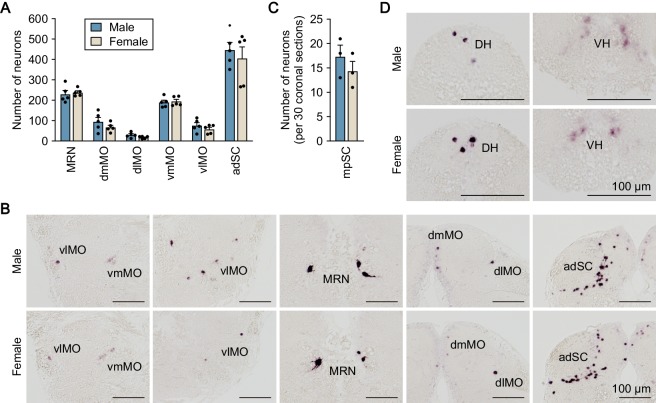
Figure 3—figure supplement 3. Distribution of npba-expressing neurons in the medaka medulla oblongata and spinal cord.

Figure 3—figure supplement 3.

(A) Distribution of npba-expressing neurons in the medulla oblongata and the anterior part of the spinal cord of males (blue columns) and females (beige columns) (n = 5 per sex). (B) Representative micrographs showing npba-expressing neurons in the respective regions of the medulla oblongata and anterior part of the spinal cord. Scale bars represent 100 μm. (C) Number of npba-expressing neurons in the middle to posterior part of the spinal cord (mpSC) of males (blue columns) and females (beige columns) (n = 3 per sex). The number of neurons per 30 coronal sections of 10 μm thickness was counted. (D) Representative micrographs showing npba-expressing neurons in mpSC. Scale bars represent 100 μm. For abbreviations of brain and spinal cord regions and brain nuclei, see Supplementary file 1.
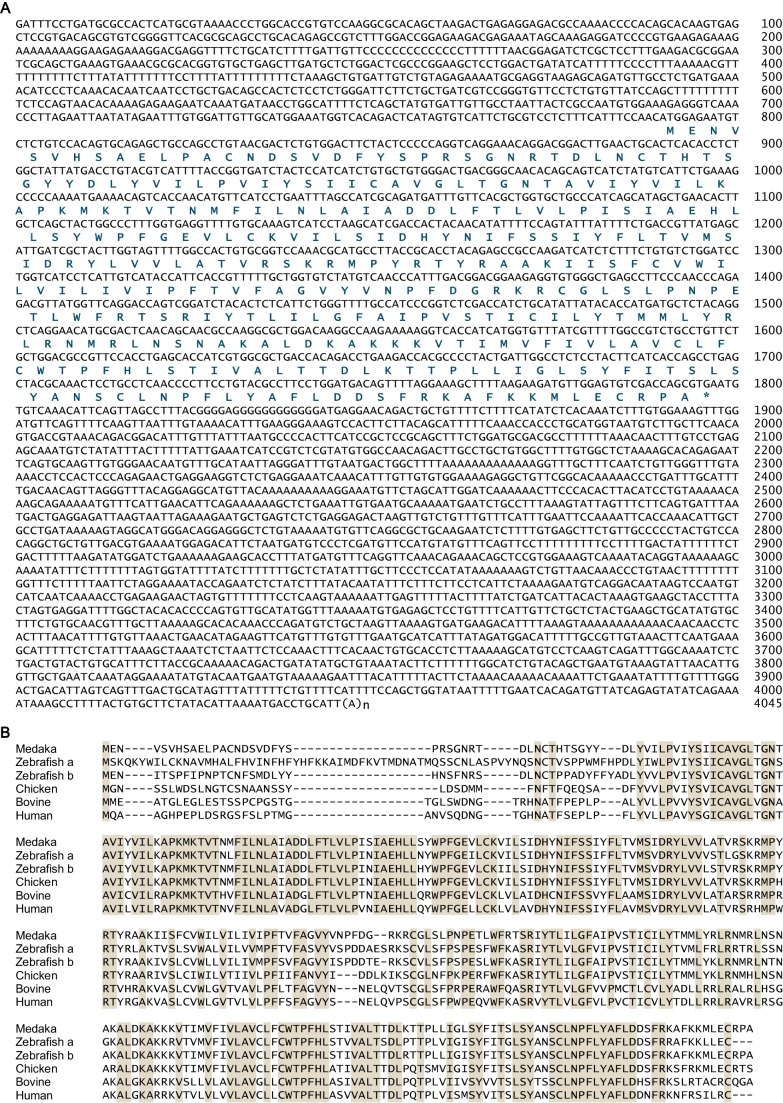
Figure 3—figure supplement 4. Sequence information for medaka npbwr2.

Figure 3—figure supplement 4.

(A) Nucleotide and deduced amino acid sequences of the medaka npbwr2 cDNA. Asterisk indicates the stop codon. Nucleotide numbers are shown at the right of each sequence line. (B) Alignment of deduced amino acid sequences of Npbwr2 from medaka and other vertebrates. Identical amino acids in all sequences are shaded in beige. For species names and GenBank accession numbers, see Supplementary file 3.