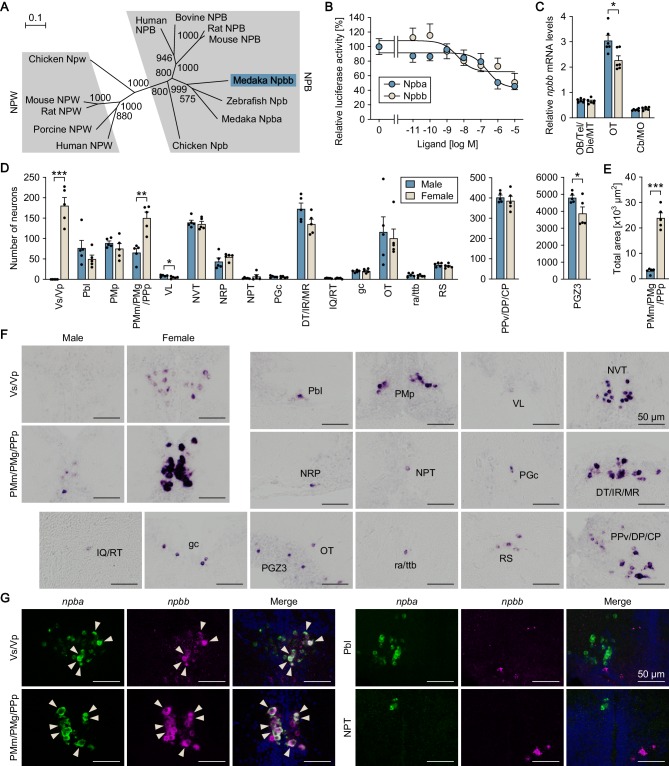
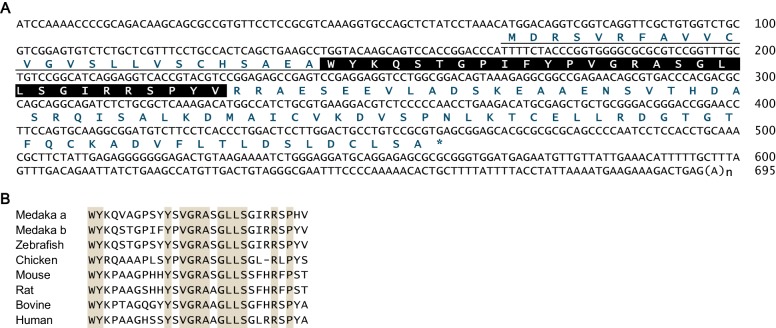
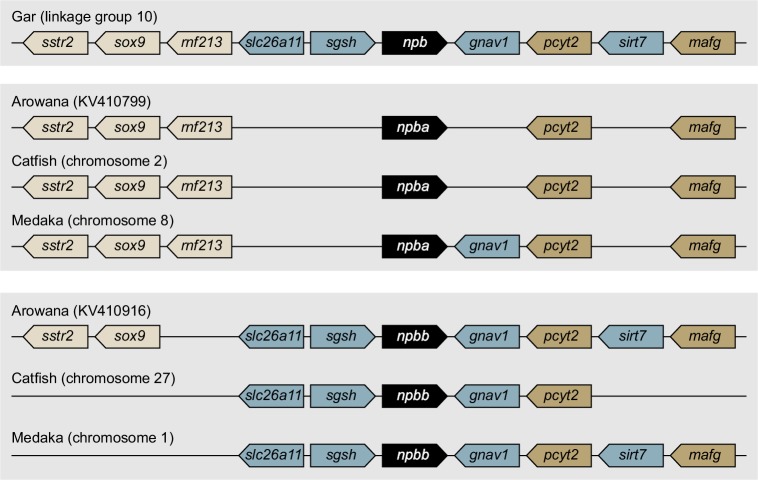
Figure 4. Medaka possess an additional NPB gene, designated npbb.
(A) Phylogenetic tree of NPB and NPW. The number at each node indicates bootstrap values for 1000 replicates. Scale bar represents 0.1 substitution per site. For species names and GenBank accession numbers, see Supplementary file 3. (B) Ability of medaka Npba and Npbb to activate medaka Npbwr2. Receptor activation was assessed by measuring cAMP-responsive element-driven luciferase activity in cells transfected with Npbwr2. The x-axis shows the concentration of Npba and Npbb, and the y-axis shows luciferase activity as a percentage of that observed in the absence of Npba/Npbb. (C) Overall levels of npbb expression in the male (blue columns) and female (beige columns) brain dissected into three parts as determined by real-time PCR (n = 6 per sex). *, p<0.05 (unpaired t-test). For abbreviations of brain regions, see Supplementary file 1. (D) Distribution of npbb-expressing neurons in the male (blue columns) and female (beige columns) brain (n = 5 per sex). The data are split into three graphs for clarity. *, p<0.05; **, p<0.01; ***, p<0.001 (unpaired t-test). For abbreviations of brain nuclei, see Supplementary file 1. (E) Total area of npbb expression in PMm/PMg/PPp in males (blue column) and females (beige column) (n = 5 per sex). ***, p<0.001 (unpaired t-test). (F) Representative micrographs showing npbb-expressing neurons in different brain nuclei. Micrographs of both sexes are shown for Vs/Vp and PMm/PMg/PPp, where npbb expression is confined or almost confined to females. Micrographs of males only are shown for other nuclei, where sex differences were not detected or, if present, were not sufficiently demonstrated by photographs. (G) Coexpression of npba and npbb in the same neurons in Vs/Vp and PMm/PMg, but not in other brain nuclei. In each set of panels, the left and middle ones show images of npba (green) and npbb (magenta) expression, respectively, in the same sections; the right ones show the merged images with nuclear counterstaining (blue). Arrowheads indicate representative neurons coexpressing npba and npbb. Scale bars represent 50 μm. For abbreviations of brain nuclei, see Supplementary file 1. See also Figure 4—figure supplement 1 and Figure 4—figure supplement 2.


