. 2019 Aug 6;8:e39495. doi: 10.7554/eLife.39495

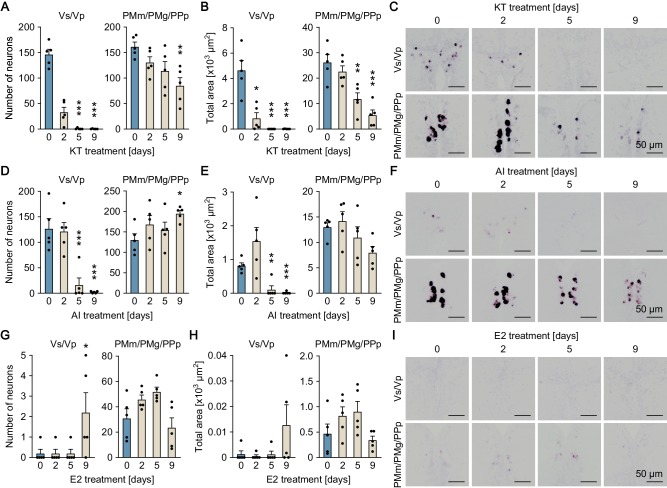
Figure 5. Sexually dimorphic npbb expression can also be reversed by altering the sex steroid milieu.

Temporal changes in npbb expression in Vs/Vp and PMm/PMg of 11-ketotestosterone (KT)-treated females (A, B, C), aromatase inhibitor (AI)-treated females (D, E, F), and estradiol-17β (E2)-treated males (G, H, I) (n = 5 per treatment and sampling day). (A, D, G) Number of npbb-expressing neurons in Vs/Vp and PMm/PMg. *, p<0.05; **, p<0.01; ***, p<0.001 (versus day 0, Dunnett’s post hoc test). (B, E, H) Total area of npbb expression in Vs/Vp and PMm/PMg. *, p<0.05; **, p<0.01; ***, p<0.001 (versus day 0, Dunnett’s post hoc test). (C, F, I) Representative micrographs showing npbb expression in Vs/Vp and PMm/PMg. Scale bars represent 50 μm. See also Figure 5—figure supplement 1 and Figure 5—figure supplement 2.

Figure 5.

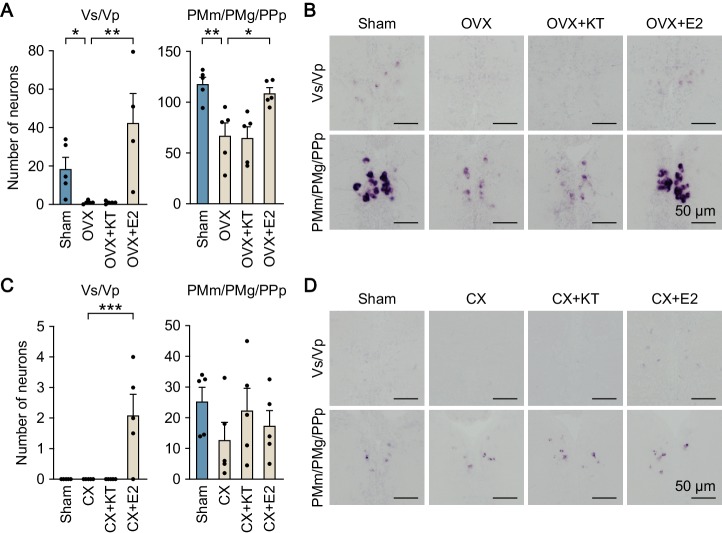
Figure 5—figure supplement 1. Effects of gonadectomy and sex steroid supplementation on npbb expression in Vs/Vp and PMm/PMg.

Figure 5—figure supplement 1.

(A) Number of npbb-expressing neurons in Vs/Vp and PMm/PMg/PPp of sham-operated females (Sham) and ovariectomized females that were exposed to vehicle alone (OVX), 11-ketotestosterone (OVX + KT), or estradiol-17β (OVX + E2) (n = 5 per group). *, p<0.05; **, p<0.01 (Bonferroni’s post hoc test). (B) Representative micrographs of npbb expression in Vs/Vp and PMm/PMg/PPp of Sham, OVX, OVX + KT, and OVX + E2 females. Scale bars represent 50 μm. (C) Number of npbb-expressing neurons in Vs/Vp and PMm/PMg/PPp of Sham males and castrated males that were exposed to vehicle alone (CX), 11-ketotestosterone (CX + KT), or estradiol-17β (CX + E2) (n = 5 per group). ***, p<0.001 (Bonferroni’s post hoc test). (D) Representative micrographs of npbb expression in Vs/Vp and PMm/PMg/PPp of Sham, CX, CX + KT, and CX + E2 males. Scale bars represent 50 μm.
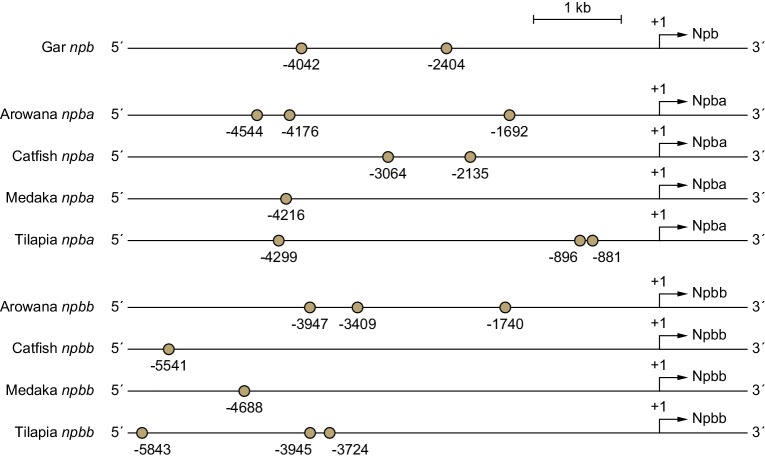
Figure 5—figure supplement 2. Putative estrogen-responsive elements (EREs) predicted in the proximal promoter regions of gar, arowana, catfish, medaka, and tilapia NPB genes.

Figure 5—figure supplement 2.

Ocher circles represent putative EREs. Numbers indicate nucleotide positions relative to the translation initiation site (+1).