. 2019 Aug 6;8:e45333. doi: 10.7554/eLife.45333

Figure 1. Design and analysis logic.

(A) During the spatio-temporal learning task, which took place in between two identical runs of a picture viewing task (Figure 1—figure supplement 1), participants repeatedly navigated a fixed route (blue line, mean ± standard deviation of median time per lap 264.6 ± 47.8 s) through the virtual city along which they encountered objects hidden in chests (numbered circles) (Deuker et al., 2016). Temporal (median time elapsed) and spatial (Euclidean and geodesic) distances between objects were dissociated through the use of three teleporters (lettered circles) along the route (Figure 1—figure supplement 2), which instantaneously changed the participant’s location to a different part of the city. (B) In the picture viewing tasks, participants viewed randomly ordered images of the objects encountered along the route while fMRI data were acquired. We quantified multi-voxel pattern similarity change between pairwise object comparisons from before to after learning the temporal and spatial relationships between objects in subregions of the entorhinal cortex. We tested whether pattern similarity change reflected the structure of the event sequence, by correlating it with the time elapsed between objects pairs (top right matrix shows median elapsed time between object encounters along the route averaged across participants). For each participant, we compared the correlation between pattern similarity change and the prediction matrix to a surrogate distribution obtained via bootstrapping and used the resulting z-statistic for group-level analysis (see Materials and methods).

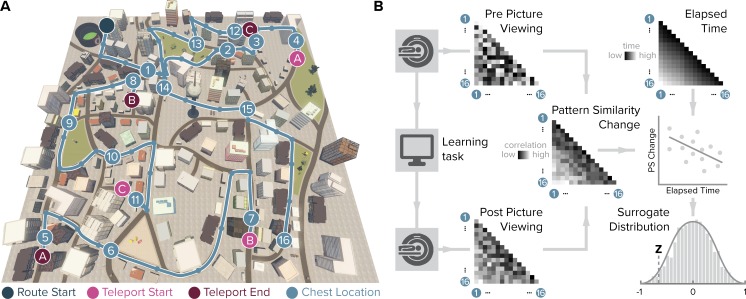
Figure 1.

Figure 1—figure supplement 1. Overview of experimental design.

Figure 1—figure supplement 1.

Participants viewed object images in random order while undergoing fMRI before and after learning the temporal and spatial relationships between these objects. The order and timing of picture presentations was held identical in both sessions to assess changes in the similarity of object representations as measured by the difference in similarity of multi-voxel activity patterns (see Materials and methods). In between the two picture viewing tasks, participants acquired knowledge about the spatial and temporal positions of objects along a route through the virtual city. Initially, the route was marked by traffic cones, but in later laps participants navigated the route without guidance. Participants encountered chests along the route and were instructed to open the chests by walking into them. Each chest contained a different object, which was displayed on a black screen upon opening the chest. Crucially, the route featured three teleporters that instantly moved participants to a different part of the city where the route continued (Figure 1). This manipulation enabled us to dissociate the temporal and Euclidean spatial distances between object pairs (Figure 1—figure supplement 2). After the second picture viewing task, participants were asked to freely recall all objects encountered along the route in the order in which they came to mind. Further, participants’ memory for temporal and spatial relationships between object pairs was assessed. Here, participants adjusted a slider to indicate whether they remembered object pairs to be close together or far apart. Temporal and spatial relations were judged in separate trials. The results of these memory tests are reported in detail in Deuker et al. (2016).

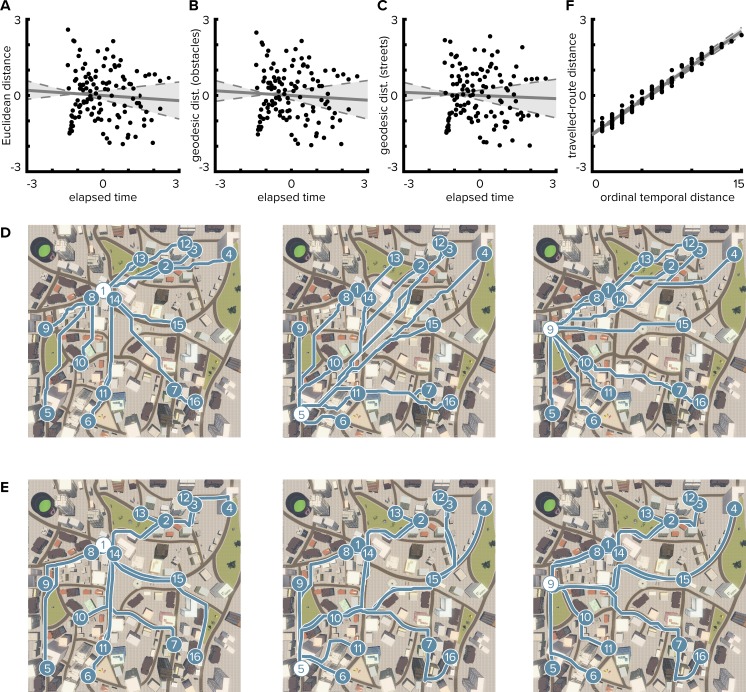
Figure 1—figure supplement 2. Temporal distances are not correlated with Euclidean or geodesic spatial distances.

Figure 1—figure supplement 2.

(A) Pairwise temporal and Euclidean spatial distances between objects are uncorrelated (Pearson r = −0.068; bootstrapped 95% confidence interval: −0.24, 0.12; p=0.462). Median times elapsed between object encounters were z-scored and then averaged across participants. Spatial distances were defined as z-scored Euclidean distances between object positions. When correlating individual median times elapsed with spatial distances, the correlation between the dimensions was not significant in any of the participants (mean ± standard deviation of Pearson correlation coefficients r = −0.068 ± 0.006, all p≥0.378). (B, C) Likewise, temporal distances were not correlated with geodesic distances between object positions. Geodesic distances were quantified based on the lengths of the shortest paths between object positions allowing navigation of all locations not obstructed by buildings and other objects (B, Pearson r = −0.061, p=0.505; CI: −0.23, 0.14; individual Pearson r = −0.061 ± 0.006, all p≥0.414) or on the city’s street network only (C, Pearson r = −0.041, p=0.653; CI: −0.22, 0.15; individual Pearson r = −0.041 ± 0.006, all p≥0.552). (D, E) Illustrations of geodesic distances based on shortest paths (blue lines) from three object positions (white circles) to all other object positions (blue circles). Shortest paths between positions were calculated using all unobstructed positions (D) or the street network (E), respectively. (F) Because both temporal distances and traveled-route distances increase monotonically with the progression of the route, ordinal temporal distances and traveled-route distances between object pairs were closely related (Spearman r = 0.986, p<0.001; CI: 0.98, 0.99; individual Spearman r = 0.986 ± 0.003, all p<0.001). Circles in (A), (B), (C and F) indicate pairwise object comparisons; solid line shows least squares line; dashed lines and shaded region highlight bootstrapped confidence intervals.