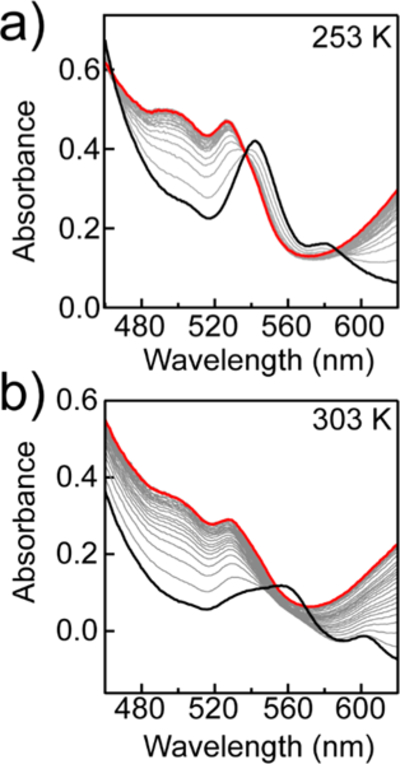
Figure 5.

(a) Spectral changes after stopped-flow mixing of [FeIII(TPP)]OTf (30 μM), pTsOH (35 mM), Fc* (3 mM), and O2 (0.33 mM) at 253 K. Black trace = initial spectrum after mixing (1 s) Red trace = final spectrum after mixing (50 s). (b) Same conditions as in panel a at 303 K. Black trace = initial spectrum after mixing (1 s) Red trace = final spectrum after mixing (20 s).
