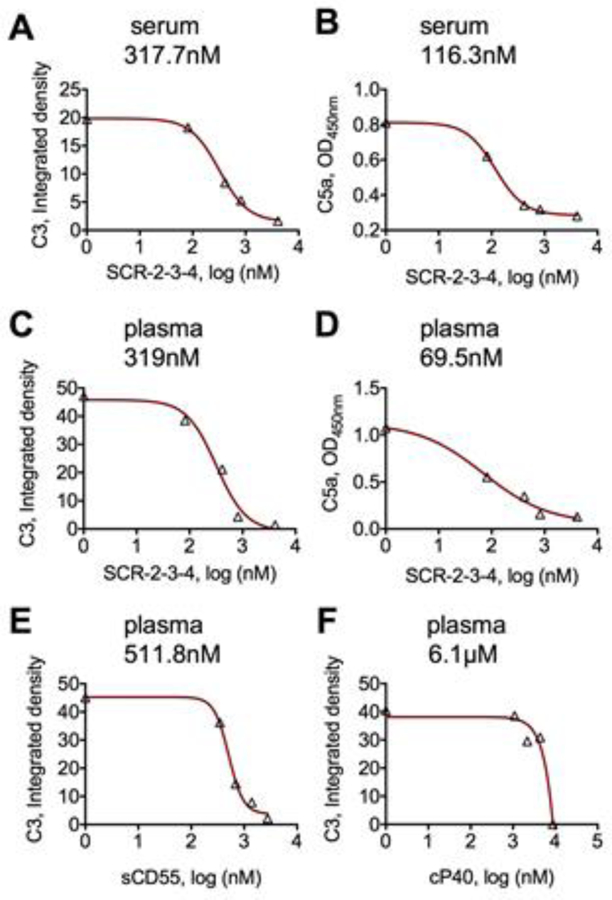
Fig. 3. Log inhibition curves (IC50) of C3 opsonization and C5a release in sera and plasma by SPIO NWs.

SPIO NWs were incubated in sera and plasma in the presence or absence of increasing concentration of inhibitors as described in Methods. A) C3 deposition, SCR-2-3-4 in serum; B) C5a levels, SCR-2-3-4 in serum; C) C3 deposition, SCR-2-3-4 in plasma; D) C5a levels, SCR-2-3-4 in plasma; E) C3 deposition, soluble CD55 in serum; F) C3 deposition, SCR-2-3-4 and cP40 (compstatin) in plasma. Each graph shows a corresponding IC50 value above. Typical inhibition curve is shown; multiple donors are compiled in Table 1. All graphs show raw values on Y-axis. Each point is the average of 3 technical replicates.
