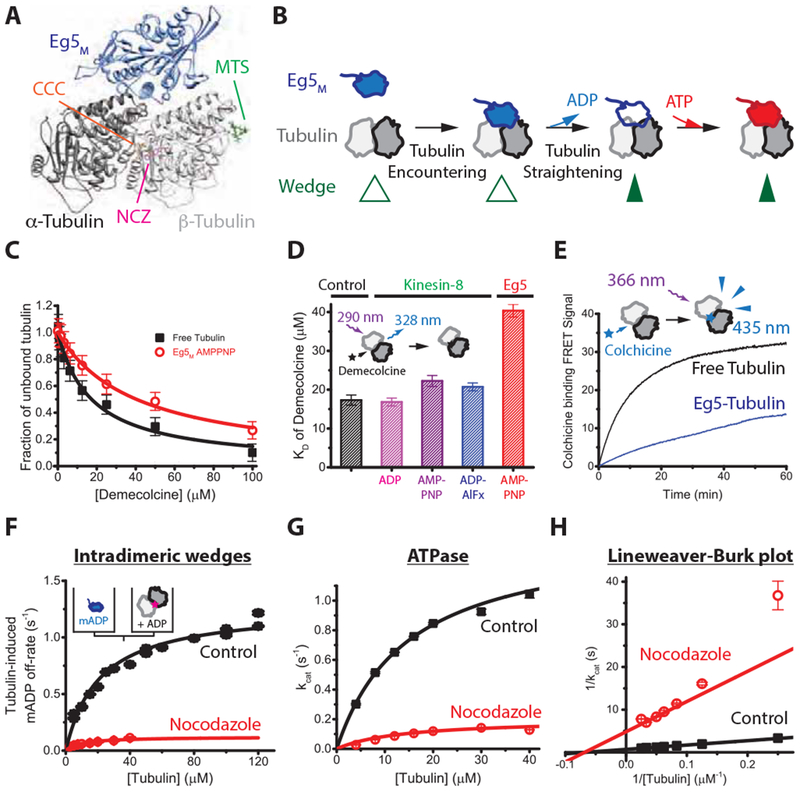
Figure 3. Eg5-binding causes a structural change that promotes tubulin assembly.

(A) Structure of Eg5 motor domain bound to free tubulin (PDB: 4AQW) and binding sites for inter- and intradimer wedge inhibitors. CCC, colchicine (PDB: 4O2B); NCZ, Nocodazole (PDB: 5CA1); MTS, Maytansinoid DM1 (PDB: 4TV8). (B) Model of coupling between nucleotide turnover in Eg5 and straightening of tubulin. Motor binding to free tubulin triggers ADP release, which causes a weak-to-strong binding transition that stabilizes the straight conformation of tubulin; ATP binding and hydrolysis follow. (C) Demecolcine binding assays based on quenching of tubulin autofluorescence by drug binding at 22 °C. Data were fit by a binding isotherm, yielding KD of 17 ± 1.3 μ M for control and KD of 40 ± 1.6 μ M in the presence of 4 μ M Eg5M and 1 mM AMPPNP that induces the strong-binding state of the motor. (D) KD for Demecolcine-tubulin binding, including results for the monomeric kinesin-8 KLP67AM across various nucleotide-states; see Figure S3A for details. (E) Kinetics of 50 μ M colchicine binding to 5 μ M tubulin in the presence or absence of AMPPNP-bound motors. Biexponential fit to control yielded fast and slow phases with rates and amplitudes of 0.169 ± 0.004 s−1 and 14 A.U., and 0.048 ± 0.001 s−1 and 19 A.U., respectively. In Eg5, fast and slow phases were 0.201 ± 0.022 s−1 and 1 A.U., and 0.0085 ± 0.0006 s−1 and 32 A.U., respectively. (F) Tubulin-induced mantADP release at 22 °C. Eg5 monomers pre-loaded with mantADP were flushed against tubulin pre-incubated with wedge inhibitors, and the resulting fluorescence fall due to mantADP release fit to a falling exponential. First-order rate constants where plotted across varying tubulin concentrations and fit to hyperbola to obtain the maximal ADP release rate, kmax, and the tubulin concentration for half-maximal release, K0.5. Control: K0.5 = 21 ± 8 μ M, kmax = 1.3 ± 0.2 s−1; Nocodazole: K0.5 = 9 ± 13 μ M; kmax = 0.12 ± 0.06 s−1 (n = 5-7 for each averaged trace; mean ± SEM). (G and H) Tubulin-stimulated Eg5M ATPase in the presence or absence of the intra-dimeric wedge inhibitor, nocodazole, at 22 C°. Control: kcat of 1.46 ± 0.04 s−1 and KM of 14.9 ± 0.8 μM tubulin; nocodazole: kcat of 0.20 ± 0.03 s−1 and KM of 14 ± 5 μM tubulin; n = 3; mean ± SEM). See also Figure S3.
