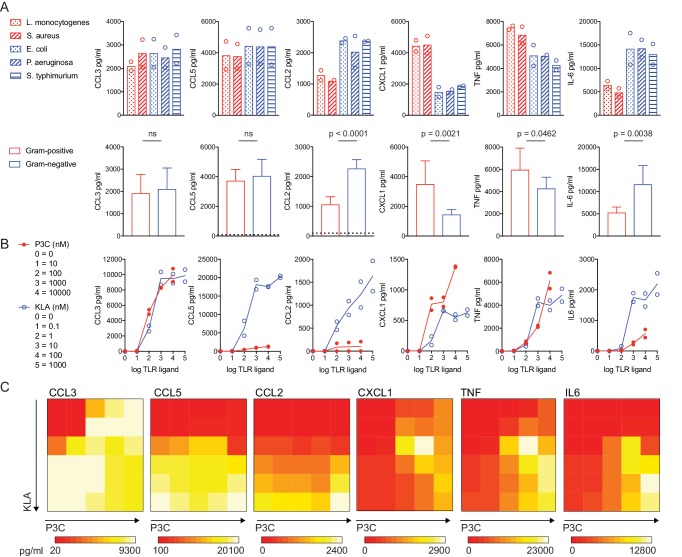
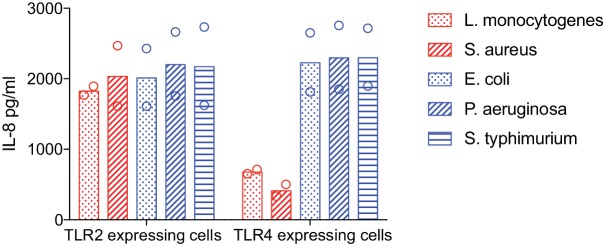
Figure 1. TLR pathway non-additivity supports context-specific inflammatory responses.
BMDM were stimulated with heat-killed bacteria at an MOI of 100 (Red = Gram-positive: L. monocytogenes or S. aureus; Blue = Gram-negative: E. coli, P. aeruginosa, or S. Typhimurium) or soluble TLR ligand (P3C = TLR2 ligand Pam3CKS4; KLA = TLR4 ligand KDO2-LipidA), as indicated. After 12 hr (A) or 6 hr (B, C) supernatants were collected and cytokines were quantified using cytometric bead array. Data points represent independent experiments. (A) Data from bacterial species (upper row) were combined from three independent experiments to show the distinct effects of Gram-positive and Gram-negative bacteria on inflammatory cytokine production in BMDM (lower row); statistical significance based on unpaired t-tests, between Gram-negative- and Gram-positive-stimulated samples. Dotted lines in the lower row represent the mean values for unstimulated BMDM (0–12 hr). In some cases, these controls are not visible because they are below the level of detection (a zero value). Ligand concentrations in (C) correspond to single ligand concentrations shown in (B), in pairwise combinations. Data are representative of three independent experiments.


