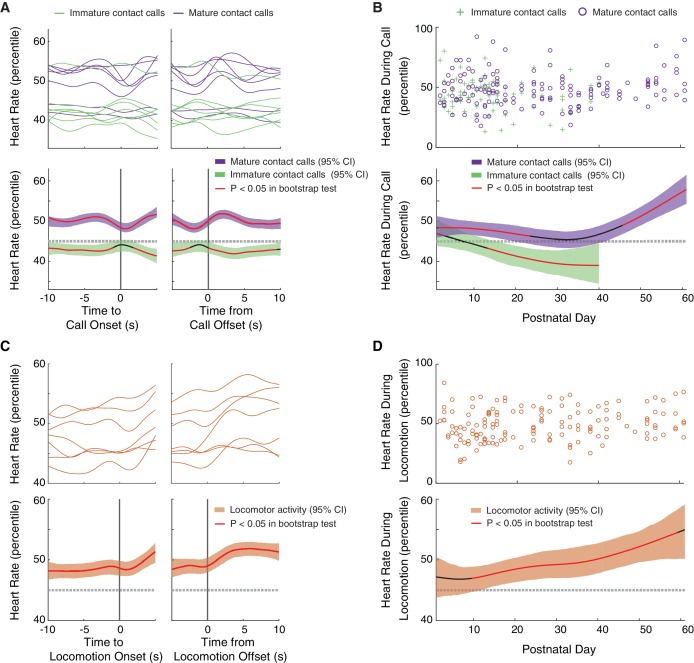
Figure 4. Mature contact calls and locomotor activity are more likely to occur during elevated arousal levels later in development.
(A) Arousal fluctuations from 10 s before to 10 s after contact call production. (A, top) Subject averages (one line per subject) of cubic splines fit to arousal level fluctuations surrounding cries (green lines) and phees (purple lines). (A, bottom) Colored cubic splines fit to population data are plotted with a 95% bootstrapped confidence interval (green – cries, purple – phees). Red line indicates observed values outside of the 95% threshold of the bootstrapped significance test. (B) Fluctuations in arousal levels during contact calls across development. (B, top) Arousal levels during cries (green pluses) and phees (purple circles) for all observation sessions. (B, bottom) Colored cubic splines fit to population data are plotted with a 95% bootstrapped confidence interval (green – cries, purple – phees). Red line indicates observed values outside of the 95% threshold of the bootstrapped significance test. (C) Arousal fluctuations from 10 s before to 10 s after locomotor activity. (C, top) Subject averages (one line per subject) of cubic splines fit to arousal level fluctuations surrounding locomotor events (orange lines). (C, bottom) A colored cubic spline (orange) fit to population data is plotted with a 95% bootstrapped confidence interval. Red line indicates observed values outside of the 95% threshold of the bootstrapped significance test. (D) Fluctuations in arousal levels during locomotor activity across development. (D, top) Arousal levels during locomotor events (orange circles) for all observation sessions. (D, bottom) A colored cubic spline (orange) fit to population data is plotted with a 95% bootstrapped confidence interval. A red line indicates observed values outside of the 95% threshold of the bootstrapped significance test, and a black line indicates observed values inside of the 95% threshold.


