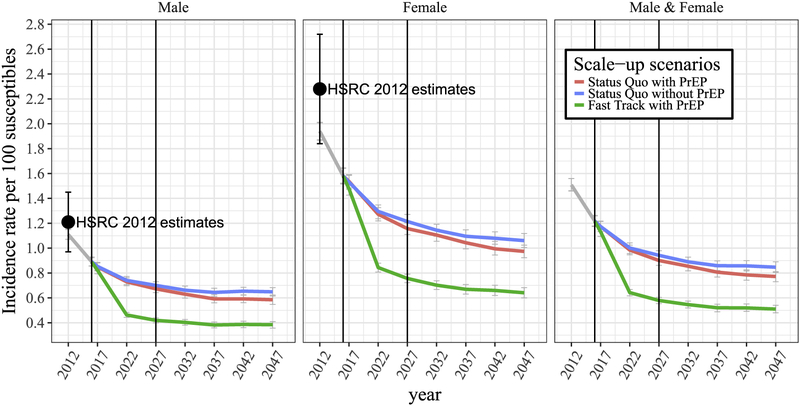
Fig. 1.
Averaged incidence rates projected under three different treatment and prevention scale-up scenarios starting in 2016, without vaccination: ‘Status Quo without PrEP’ in blue, ‘Status Quo with PrEP’ in red, ‘Fast Track with PrEP’ in green, and the average across all three scale-up scenarios in grey. (For interpretation of the references to colour in this figure legend, the reader is referred to the web version of this article.)

