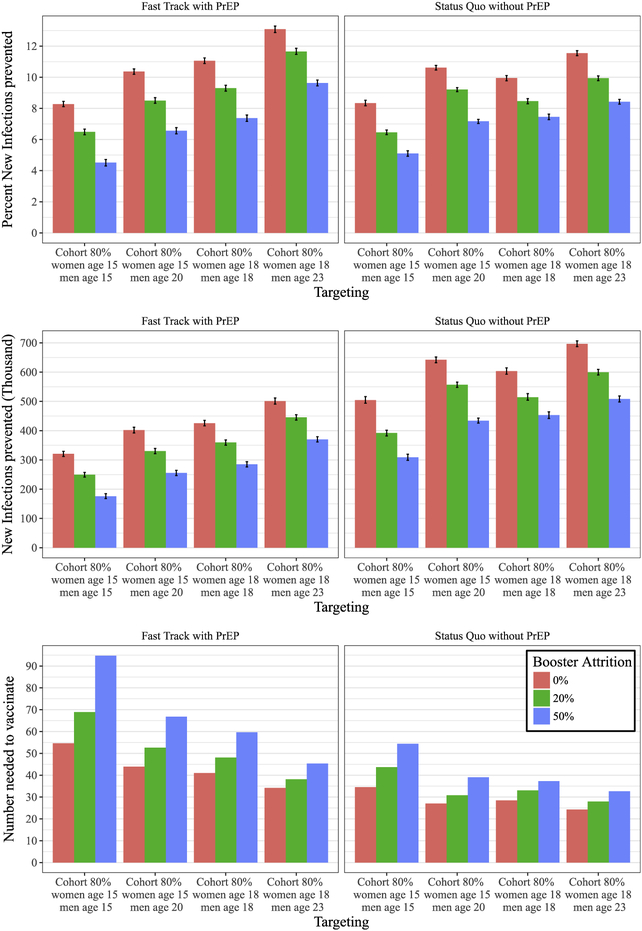
Fig. 3.
Impact of cohort vaccination at 80% coverage for different treatment scale-up scenarios measured by average number of new infections (first row), percent of new infections prevented (second row), and number needed to vaccinate (third row) between 2027 and 2047 at 50% vaccine efficacy and varying levels of booster attrition (0%, 20% and 50%). Average and 95% confidence intervals are relative to summary statistics across stochastic replicates.

