Figure 3.

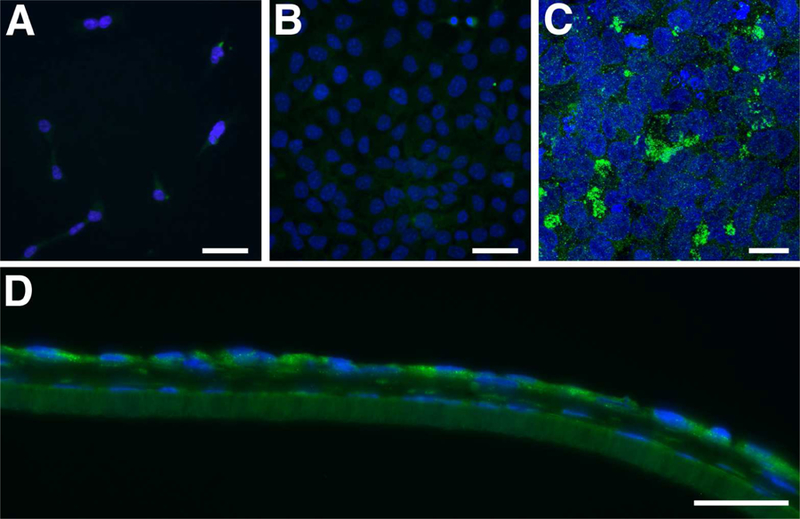
ALDH1A1 localization. (A and B) 2D culture of HCEndoCL. (A) Single cells, or cells that have little physical cell-cell contact. (B) Near confluent HCEndoCL. (C and D) Co-culture of HCEndoCL with 3D HCF construct. Confocal maximum projection of the HCEndoCL co-culture (C) and frozen cross-section of 5-day co-culture (D) Bars = 50 microns; Green = ALDH1A1; Blue = DAPI (A, B, D) or TOPRO3 (C).
