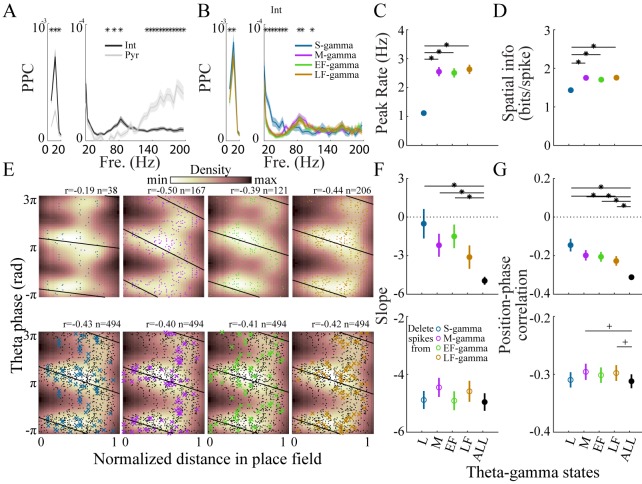
Figure 5. Interneurons and place cell activity in the four TG states.
(A) Spike-field pairwise phase consistency (PPC) for interneurons (n=100) and pyramidal cells (mean ± sem, n=266), * represents significant cell-type differences (one-way repeated measures ANOVA, q < 0.05, FDR correction from 33 comparisons). (B) Spike-field PPC of interneurons in the four TG states. * indicates significant differences across TG states (one way repeated measures ANOVA, q < 0.05, FDR correction from 33 comparisons). (C) Peak firing rate of place cells (n=142) for different TG states. * indicates significant differences (paired t test, q < 0.05, FDR correction for six comparisons). (D) Spatial information of place cells (n=142) for different TG states. * indicates significant differences (paired t test, q < 0.05, FDR correction for 6 comparisons). (E) Phase precession of an example unit (Unit 1008, rat Achilles S11012013) for four different TG states, thick black line shows phase-position regression (top). Phase precession of the same unit after randomly deleting 38 spikes (represented by ×), the minimum number of spikes of the four states, from each TG state (bottom). The place field entry and exit were normalized to 0 and 1, respectively, on the x axis; the phase-position correlation coefficient, r, is shown above each figure. (F) Slope of phase-position regression (n=142 fields) for each TG state (top panel) and after deleting spikes for each TG state (for each unit, results are averaged from 100 random deletions). Black dots indicate measures from including all spikes. * indicates significant differences (paired t test, q < 0.05, FDR correction for 10 comparisons); + indicates comparison reached significance threshold of q < 0.1. (G) As in (F) for phase-position correlation of the 142 place fields. sem, standard error of the mean.
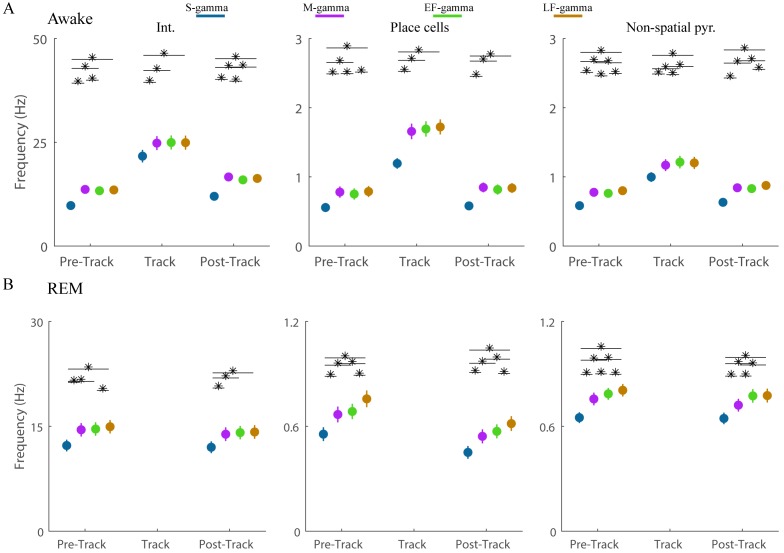
Figure 5—figure supplement 1. Firing rates of single units during the four TG states in awake periods.
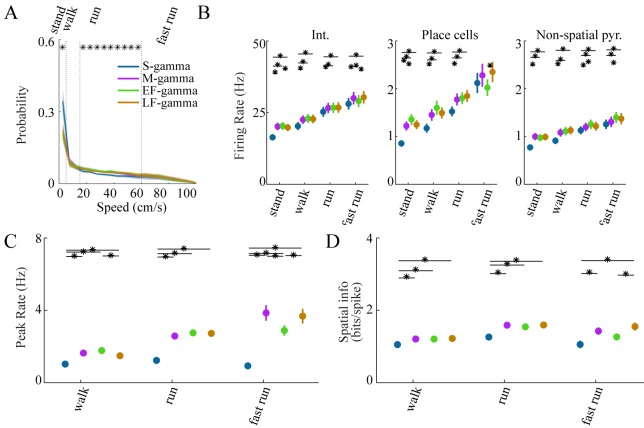
Figure 5—figure supplement 2. Neural firing properties across different animal speeds.
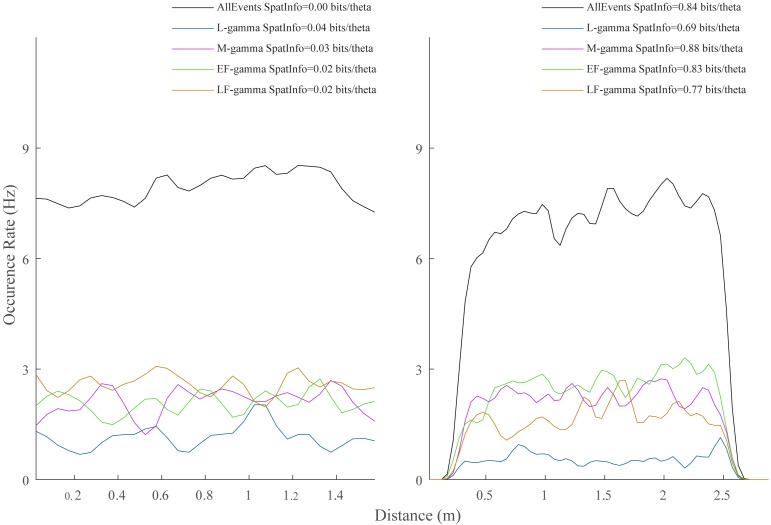
Figure 5—figure supplement 3. TG event occurrence as a function of animal spatial position.
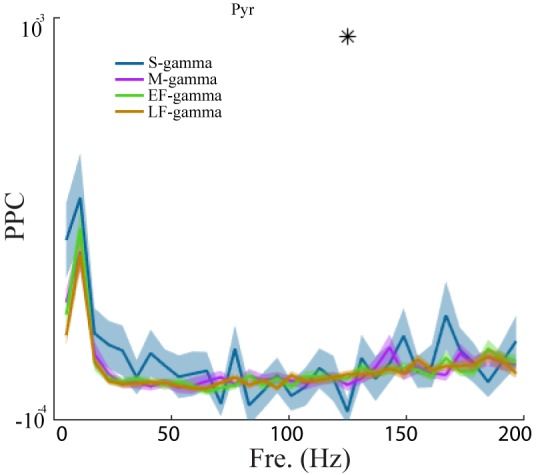
Figure 5—figure supplement 4. Pairwise phase consistency of pyramidal cells in the four gamma states.
