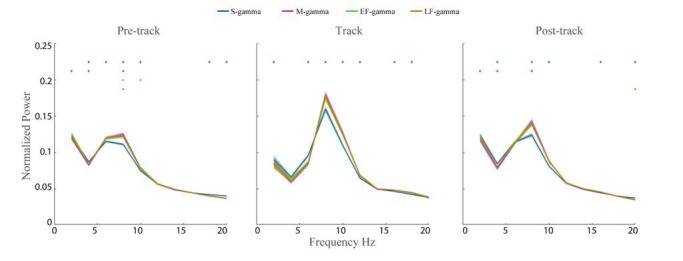
Author response image 2. Theta Power across TG states.

The wavelet spectrum shown (2-20 Hz) was calculated for LFPs from Hc-11 data sets (n=48 channels) during awake pre-maze (left), maze (middle), and post-maze periods (right) over 2-200 Hz. The raw LFP power was normalized by dividing by the total power between 2 Hz and 200 Hz. Colored dots above indicate a TG state was significantly different from all other states (paired t-test, q < 0.05, FDR correction of 186 = 6 states pairs × 31 Frequency sample comparisons).
