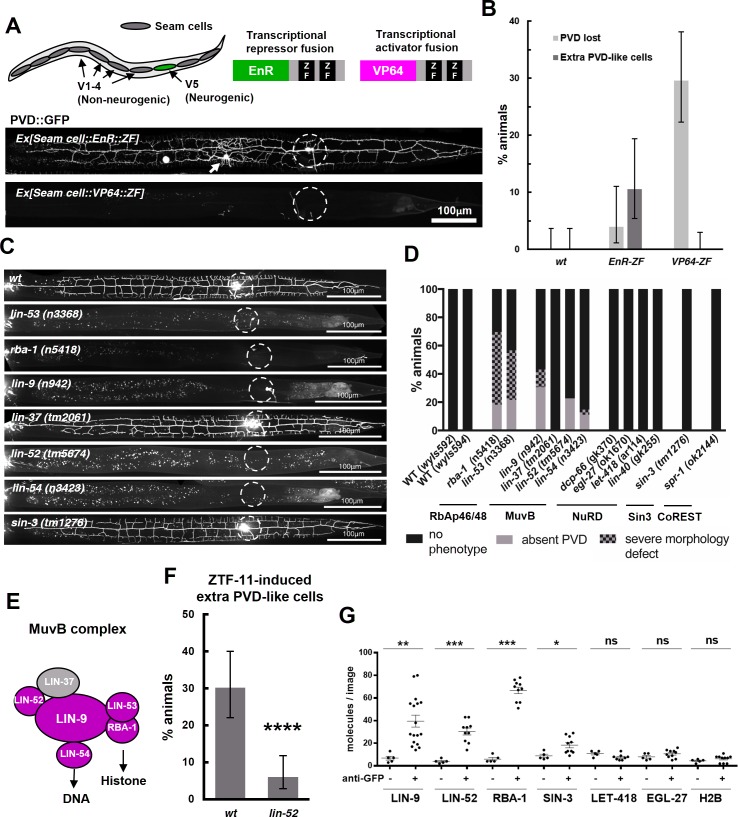
Figure 10. ZTF-11 functions with the MuvB co-repressor complex.
(A) Top, schematic diagram of the experiment. Transcriptional repressor (EnR-ZF) or activator (VP64-ZF) fusion proteins were expressed in both neurogenic V5 and non-neurogenic V1-4 seam cells. Bottom, representative confocal images showing extra PVD-like cells generated with EnR-ZF expression or loss of PVD generated with VP64-ZF expression. (B) Quantification of respective fusion protein overexpression phenotypes. Error bars are 95% Wilson-Brown C.I. n = 100, 76, 125 for wt, EnR-ZF, VP64-ZF, respectively. See Figure 10—source data 1 for numerical data. (C) Representative confocal images showing postdeirid neurogenesis phenotypes in wild type, MuvB, or Sin3 co-repressor complex mutants. (D) Quantifications of PVD neurogenesis defects of MuvB, Sin3, NuRD, or CoRest co-repressor complexes. n = 27–117. (E) Schematic diagram of core components of MuvB complex. Genes required for postdeirid neurogenesis are colored in magenta. See also Figure 10—figure supplement 1 for fly and human orthologs. (F) Proneural activity of ztf-11 requires MuvB gene lin-52. ZTF-11 was ectopically expressed in seam cells in wild type (N2) or lin-52(tm5674) backgrounds and transgenic animals were scored for presence of ectopic PVD-like cells. Error bars are 95% Wilson-Brown C.I. n = 96, 117, respectively. Binomial test, ****p<0.0001. See Figure 10—source data 2 for numerical data. (G) SiMPull experiment shows binding of MuvB complex components to ZTF-11. Error bars, S.E.M. n = 5–17 each. Student’s t-test two-tailed *p<0.05, **p<0.005, ***p<0.0005. See Figure 10—source data 3 for numerical data.
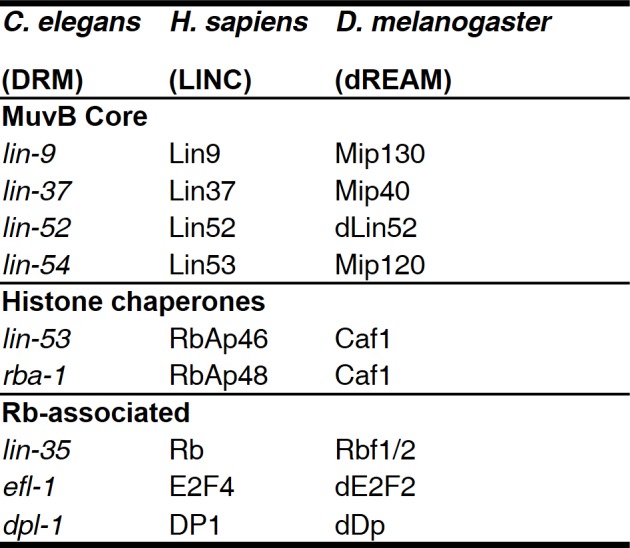
Figure 10—figure supplement 1. MuvB complex genes and their homologs in model organisms.


