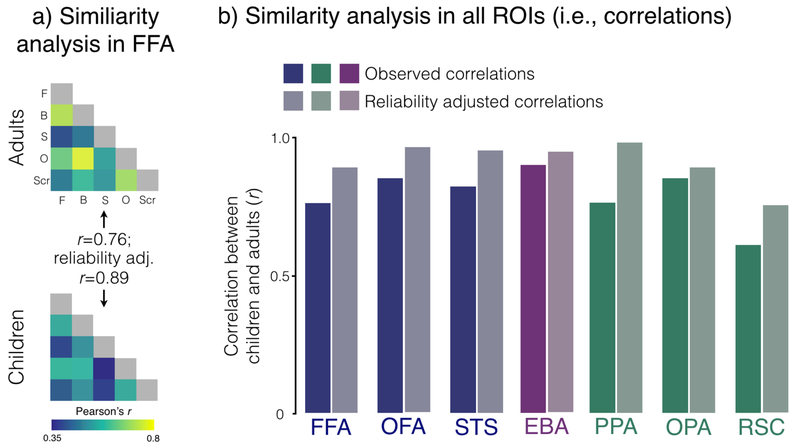
Figure 8.
Representational similarity analysis comparing children and adults. A) Visualization of the similarity matrices based on distributed activation patterns in the FFA voxels in adults (top matrix) and children (bottom matrix). Each cell corresponds to the correlation of the activation patterns within a particular region for two stimulus categories (e.g., the correlation between the pattern of response across voxels to objects and bodies in FFA, etc.). B) Correlations between children and adults in each of our neural regions. The y-axis shows the correlation between the two groups. For each neural region, the saturated bar represents the observed correlation between children and adults while the desaturated bar represents the reliability adjusted correlation (see Methods).

