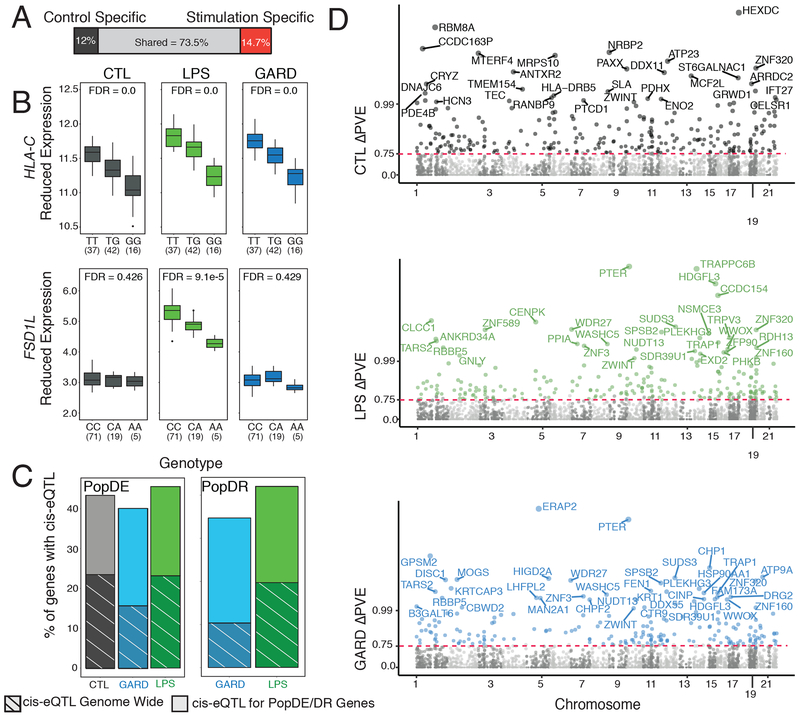
Fig. 3. Analysis of the contribution of genetics to differences in immune response between the HG-Batwa and the AG-Bakiga.
(A) Schematic representation of the number of cis-eQTL shared across all conditions, or only found in non-infected PBMCs, or found in LPS and/or GARD stimulated PBMCs (stimulation-specific eQTL). Stimulation-specific eQTL were defined as those showing very strong evidence of eQTL in the stimulated cells (FDR < 0.05), and very limited evidence in the non-infected cells (FDR always higher than 0.25). (B) Example of two cis-eQTL. The top example, HLA-C, was found across all experimental condition (CTL-FDR = 0.0, LPS-FDR = 0.0, GARD-FDR = 0.0). The bottom example, Fibronectin Type III and SPRY Domain Containing 1 Like (FSD1L) was detected exclusively in the LPS condition. In this example expression is in log2(counts per million) (CTL-FDR = 0.426, LPS-FDR = 9.09−5, GARD-FDR = 0.429). The upper and lower ends of the boxplot whiskers correspond to plus or minus 1.5 times the interquartile range, respectively. (C) Bar graphs showing an enrichment of genes containing cis-eQTLs among PopDE/PopDR genes (totality of bars) per compared to genome wide expectations (stripes). (D) Manhattan plot showing ΔPVE of cis-eQTL (normalized as -log10(1-ΔPVE for easier viewing) on the Y-axis across all chromosomes for CTL (gray), GARD (blue), and LPS (green). Colored points have an FDR < 0.1 and a delta-PVE > 0.75. Points are labeled with the corresponding gene name when the PVE is > 0.99.

