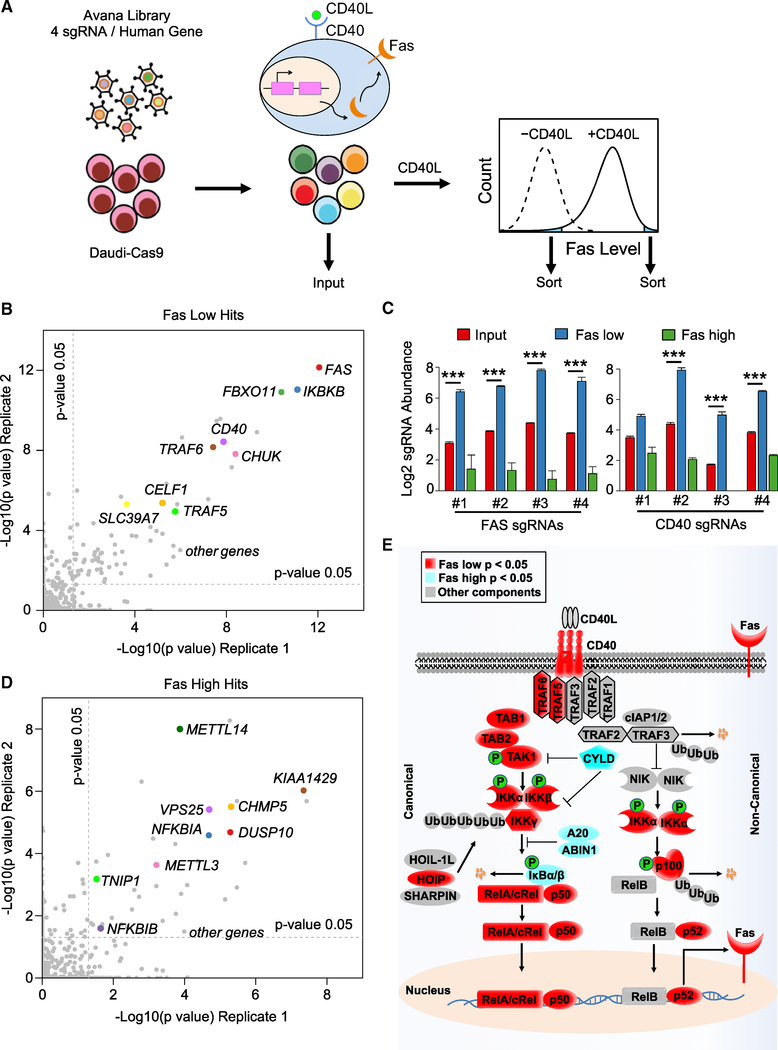
Figure 1. CRISPR/Cas9 Screens Identify Positive and Negative Regulators of CD40 Responses in B Cells.
(A) CRISPR/Cas9 screen workflow and screening strategy. Cas9+ Daudi B cells were transduced with the Avana sgRNA library at MOI 0.3, stimulated by multimerized CD40L at 50 ng/mL for 48 h and sorted for the 3% of cells with the lowest or highest Fas expression.
(B) Scatterplots showing the statistical significance of selected hits in the screen for CD40 positive regulators. −Log10(p value) for two biological screen replicates are shown. Statistical significance was quantitated by the STARS algorithm, using one biological screen replicate for each axis. Selected CD40 positive regulator screen hits are highlighted.
(C) Log2 sgRNA abundances in the indicated cell populations. sgRNA values in the input CRISPR Daudi cell library (red), in the sorted Faslow (blue) and Fashigh (green) populations are shown. Mean ± SD of two input libraries and four screen replicates are shown. ***p < 0.001.
(D) Scatterplots showing the −log10(p value) for two biological screen replicates. Selected CD40 negative regulator screen hits are highlighted.
(E) Schematic diagram of the CD40/NF-κB pathway, highlighting known components that scored in our screens. Positive regulator Faslow screen hits with p < 0.05 (red) or negative regulator Fashigh screen hit with p < 0.05 (light blue) are highlighted.
See also Figure S1.

