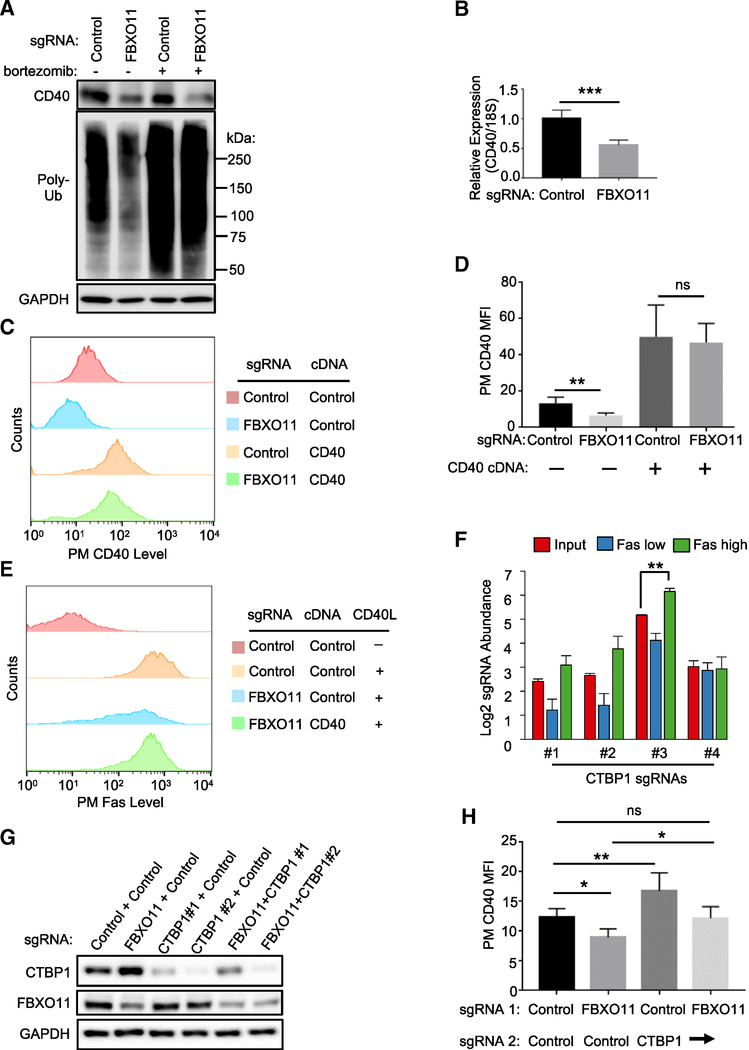
Figure 3. FBXO11 Supports CD40 Expression by Targeting the Repressor CTBP1.
(A) Immunoblot analysis of CD40, poly-ubiquitin (poly-Ub), or control GAPDH levels in WCE from Cas9+ Daudi B cells that expressed the indicated sgRNA, treated with DMSO or the proteasome inhibitor bortezomib (200 nM) for 16 h. Increased poly-Ub signal indicates on-target bortezomib activity.
(B) qRT-PCR analysis of CD40 mRNA abundances relative to 18S control levels in Cas9+ Daudi B cells expressing the indicated sgRNA.
(C) FACS analysis of PM CD40 abundances in Cas9+ Daudi B cells expressing the indicated control or FBXO11 targeting sgRNA as well as the indicated control or CD40 cDNA construct.
(D) FACS analysis of Daudi B cell PM CD40 MFI as in (C) from n = 3 replicates.
(E) FACS analysis of PM Fas abundances in Cas9+ Daudi B cells expressing the indicated control or FBXO11 targeting sgRNA as well as the indicated control or CD40 cDNA rescue construct, stimulated by Mega-CD40L (50 ng/mL for 48 h), as indicated.
(F) Mean + SD Log2-normlized CTBP1 sgRNA abundances from both pre-FACS sort input libraries and from all four screen replicates are shown.
(G) Immunoblot analysis of CTBP1, FBXO11, and GAPDH control abundances in WCE from Cas9+ Daudi B cells expressing the indicated control, FBXO11, or either of two independent CTBP1 targeting sgRNAs.
(H) PM CD40 abundances in Cas9+ Daudi B cells expressing the indicated two sgRNAs.
Mean + SD levels from at least n = 3 experiments and shown in (B), (D), and (H). *p < 0.05, **p < 0.01, ***p < 0.001, ns, non-significant. Immunoblot results were representative of n = 3 experiments.
See also Figure S3.

