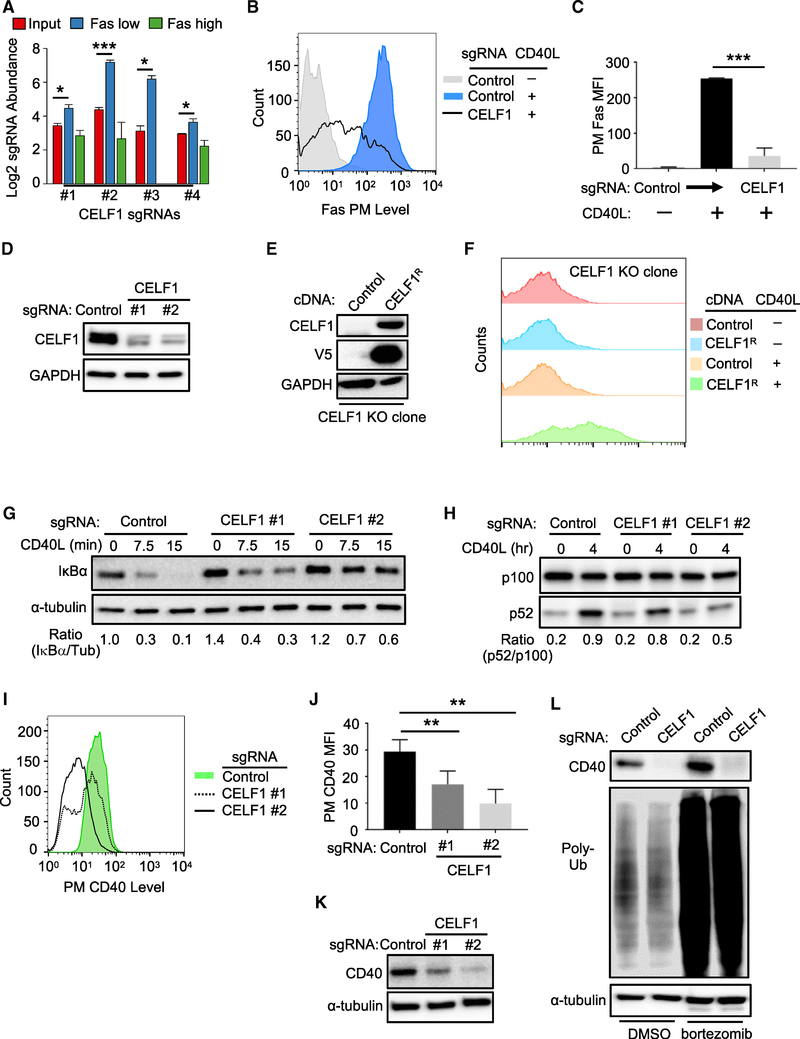
Figure 4. CELF1 Is a Critical Dependency Factor for B Cell CD40 Expression.
(A) Log2-normlized CELF1 sgRNA abundances of the indicated CRISPR screen cell populations. Mean + SD of two input libraries and four screen replicates are shown.
(B) FACS analysis of PM Fas levels in Cas9+ Daudi B cells expressing the indicated sgRNA and stimulated by 50 ng/mL Mega-CD40L for 48 h where indicated.
(C) PM MFI Fas abundances as in (B) from n = 3 experiments.
(D) Immunoblot of CELF1 or control GAPDH abundances using WCE from Cas9+ Daudi B cells expressing control or independent CELF1 targeting sgRNAs.
(E) Immunoblot of CELF1, V5 epitope-tagged CEFL1, or control GAPDH abundances in WCE from single-cell Cas9+ Daudi B cell control or CELF1 KO clones with stable V5-tagged CELF1 rescue (CELF1R) cDNA expression.
(F) FACS analysis of PM Fas abundances in Daudi B cell CELF1 KO expressing control or CELF1R cDNAs and stimulated by Mega-CD40L (50 ng/mL) for 48 h, as indicated.
(G) Immunoblot analysis of IκBα or tubulin load control abundances in WCE from Cas9+ Daudi B cells expressing control or CELF1 sgRNA and treated with 50 ng/mL Mega-CD40L for the indicated minutes (min). Ratios of IκBα/tubulin (tub) abundances are shown beneath each lane.
(H) Immunoblot analysis of p100 and p52 abundances in WCE from Cas9+ Daudi B cells expressing control or CELF1 sgRNA and treated with 50 ng/mL Mega-CD40L for the indicated hours (h). Ratios of p100:p52 abundances are shown beneath each lane. The immunoblot was representative of n = 3 experiments.
(I) FACS analysis of PM CD40 abundances in Cas9+ Daudi B cells expressing either control or one of two independent CELF1 sgRNAs.
(J) FACS analysis of Cas9+ Daudi B cell PM CD40 MFI as in (I) from n = 3 replicates
(K) Immunoblot analysis of CD40 or tubulin abundances in WCE from Cas9+ Daudi B cells expressing control or CELF1 sgRNAs.
(L) Immunoblot of CD40, Poly-Ub, or tubulin abundances in WCE from Cas9+ Daudi B cells that expressed the indicated sgRNA and that were treated with control DMSO or the proteasome inhibitor bortezomib (200 nM) for 16 h.
Mean + SD from n = 3 are shown in (C) and (J). **p < 0.01; ***p < 0.001. All immunoblots were representative of at least n = 3 replicates.
See also Figure S4.

