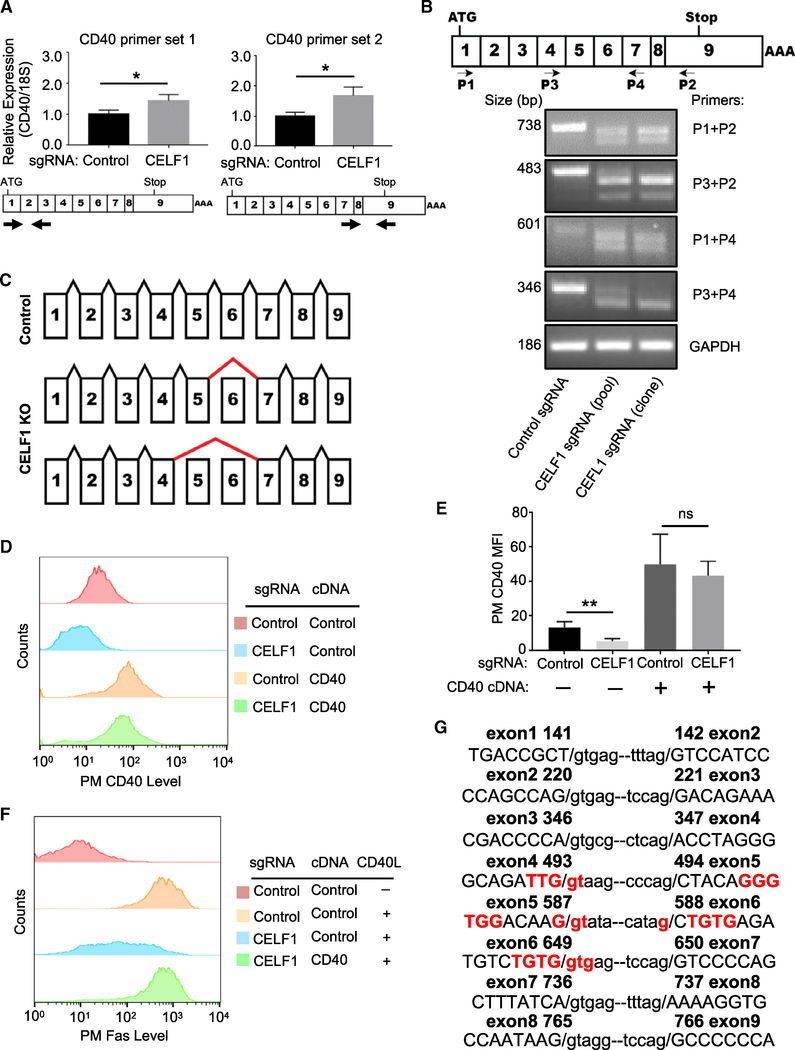
Figure 5. CELF1 Is Required for Proper CD40 mRNA Splicing.
(A) qRT-PCR analysis of 18S-rRNA normalized CD40 mRNA levels in Cas9+ Daudi B cells expressing the indicated control or CELF1 sgRNAs. Schematic maps of CD40 cDNA and primer sets used are shown below.
(B) Schematic diagram of CD40 exons and primers used for diagnostic analyses. Shown below is PCR analysis of CD40 mRNA species, amplified by the indicated primers by RT-PCR from Cas9+ Daudi B cell control, CELF1 KO pools, or a single-cell CELF1 KO clone.
(C) Schematic diagram of CD40 mRNA splicing in control versus CELF1 KO cells. Positions of aberrant splicing are indicated by thick red lines.
(D) FACS analysis of PM CD40 abundances in Daudi B cells expressing the indicated control or CELF1 sgRNAs as well as control or CD40 cDNA constructs.
(E) FACS analysis of PM CD40 abundances as in (D) from n = 3 replicates.
(F) FACS analysis of PM Fas MFI in Daudi B cells with the indicated sgRNA and cDNA expression, stimulated by 50 ng/mL Mega-CD40L for 48 h, as indicated.
(G) CEFL1 exon (in capitals) and intron (in small case) boundary sequences, with sequence encoding putative CELF1 GU-rich binding sites highlighted in red. Nucleotide number of human CD40 cDNA is indicated.
Mean + SD from n = 3 experiments are shown in (A) and (E), with *p < 0.05, **p < 0.01, ns, non-significant. (B), (D), and (F) are representative of at least n = 3 experiments.
See also Figure S5.

