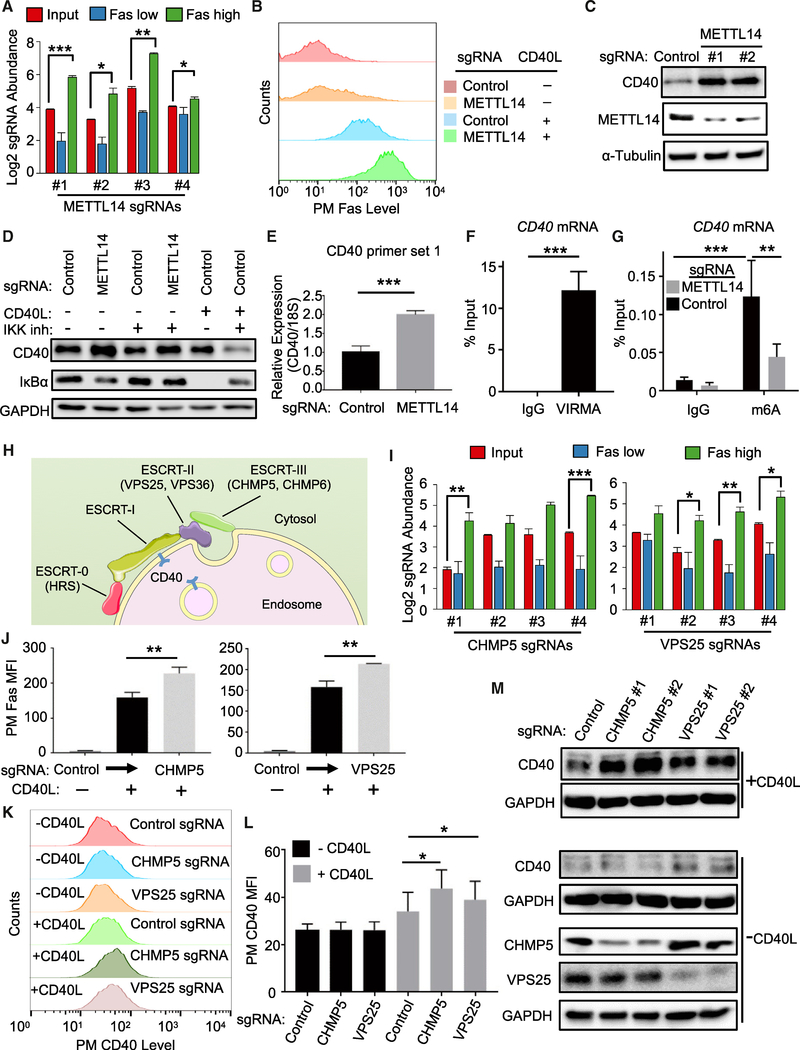
Figure 6. The m6A Writer METTL3-METTL14-WTAP and ESCRT Negatively Regulates CD40 Abundance.
(A) Log2-normlized CRISPR screen mean + SD abundances are shown for sgRNAs targeting the gene encoding METTL14. Mean + SD of two input libraries and four screen replicates are shown.
(B) FACS analysis of PM Fas abundances in Cas9+ Daudi B cells expressing control or METTL14-targeting sgRNAs and stimulated by 50 ng/mL Mega-CD40L for 48 h, as indicated.
(C) Immunoblots analysis of CD40, METTL14, or control tubulin abundances in WCE from Cas9+ Daudi B cells expressing the indicated sgRNAs.
(D) Immunoblots analysis of CD40, IκBα, or GAPDH abundances in Cas9+ Daudi B cells expressing the indicated sgRNAs pre-treated for 1 h with 5 μM Calbiochem IKK inhibitor VIII (IKK inh) and then treated with IKK inh together with 50 ng/mL Mega-CD40L for an additional 12 h, as indicated.
(E) RT-PCR analysis of 18S-rRNA normalized CD40 mRNA levels in Cas9+ Daudi B cells expressing the indicated sgRNA.
(F) RT-qPCR analysis of Daudi B cell CD40 mRNA immunopurified by control IgG versus IgG against WTAP component VIRMA, expressed as a percentage of WCE input CD40 RNA abundance.
(G) RT-qPCR analysis of CD40 abundances in control IgG versus anti-m6A mRNA immunoprecipitations from Cas9+ Daudi B cells that expressed control or METTL14 sgRNAs. Immunopurified CD40 mRNA abundances are expressed as a percentage of input CD40 mRNA levels.
(H) Schematic highlighting ESCRT component CD40 negative regulator screen hits. ESCRT-0, II, and III subunits hits included genes encoding HRS, VPS25,VPS36, CHMP5, and CHMP6.
(I) Log2-normalized CRISPR screen CHMP5 and VPS25 sgRNA abundances. Mean + SD of two input libraries and four screen replicates are shown.
(J) FACS analysis of PM Fas abundance in Cas9+ Daudi B cells with the indicated control, CHMP5, or VPS25 sgRNAs and stimulated with 50 ng/mL Mega-CD40L for 48 h, as indicated.
(K) FACS analysis of PM CD40 abundances in Cas9+ Daudi B cells with the indicated control, CHMP5, or VPS25 sgRNAs and stimulated with 50 ng/mL Mega-CD40L for 24 h, as indicated.
(L) PM MFI Fas abundances as in (K) from n = 3 experiments.
(M) Immunoblot analysis of WCE from Cas9+ Daudi B cells expressing the indicated control or either of two independent CHMP5 or VPS25 targeting sgRNAs and stimulated for 24 h with 50 ng/mL Mega-CD40L, as indicated.
Mean + SD from n = 3 are shown in (E)–(G), (J), and (L). *p < 0.05, **p < 0.01, ***p < 0.001. All immunoblots are representative of at least n = 3 experiments.
See also Figures S6 and S7.

