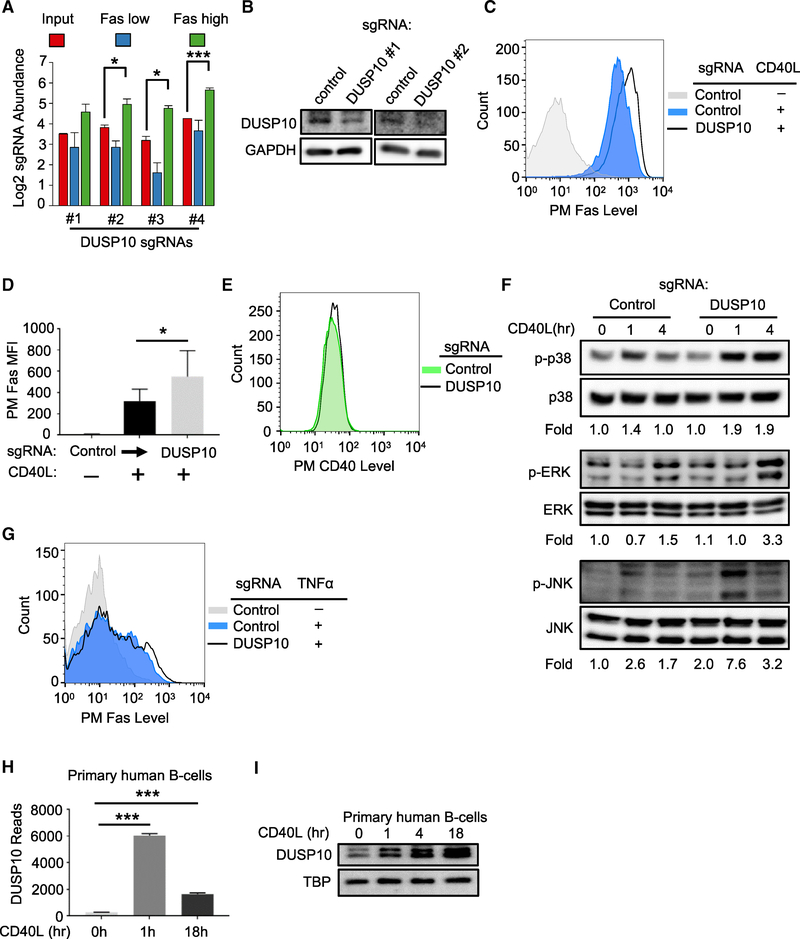
Figure 7. The Phosphatase DUSP10 Is a CD40/MAPK Pathway Negative Feedback Regulator.
(A) Log2-normlized CRISPR screen mean + SD abundance values for DUSP10 sgRNAs.
(B) Immunoblots of DUSP10 or control GAPDH abundances in WCE from Cas9+ Daudi cells expressing control or independent DUSP10 sgRNAs.
(C) FACS analysis of PM Fas levels in a representative experiment with Cas9+ Daudi cells expressing the indicated control or DUSP10 sgRNA and stimulated by 50 ng/mL Mega-CD40L for 48 h as shown.
(D) FACS analysis of PM Fas MFI as in (C) from n = 3 experiments.
(E) FACS analysis of PM CD40 expression in Cas9+ Daudi B cells expressing control versus DUSP10 sgRNAs.
(F) Immunoblot analysis phosphorylated and total p38, ERK, and JNK MAPK abundances in WCE from Cas9+ Daudi B cells expressing the indicated sgRNAs and stimulated by 50 ng/mL Mega-CD40L for the indicated hours. Shown below are the ratios of phosphokinase to total kinase signal from a representative experiment. Ratios in unstimulated cells with control sgRNA expression were normalized to a value of 1.
(G) FACS analysis of PM Fas level in Cas9+ Daudi B cells treated with 10 ng/mL TNF-α for 24 h, as indicated.
(H) DUSP10 RNA-seq reads in primary human B cells stimulated with CD40L for 0, 1, or 18 h.
(I) Immunoblot analysis of DUSP10 versus loading control TBP abundances from primary human B cells stimulated with 50 ng/mL Mega-CD40L for 0, 1, 4, or 18 h. Immunoblots were representative of n = 3 experiments. Mean and SD values from three independent experiments are shown in (D) and (H). *p < 0.05, ***p < 0.001. Cas9+ Daudi B cells were used in (A)–(G).
See also Figure S7.

