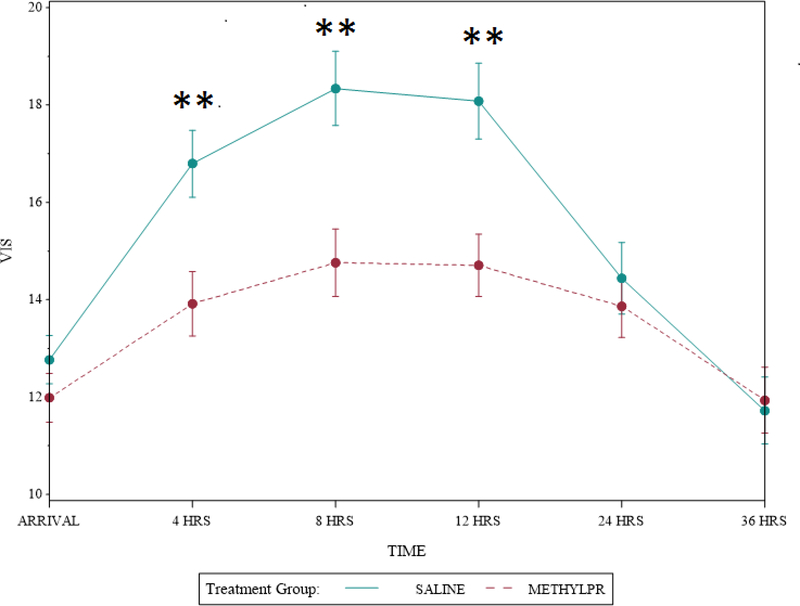
Figure 3: Vasoactive Inotropic Score over Time by Treatment Group at Site 1.
Methylprednisolone treatment resulted in lower vasoactive inotropic score at 4, 8, and 12 hours at site 1. Circles represent the mean and error bars represent the standard deviation. They were generated by estimating the mean and variance of the VIS measure over time separately for each group and each time point. Abbreviations: VIS, vasoactive inotropic score; Hrs, hours. **p<0.01

