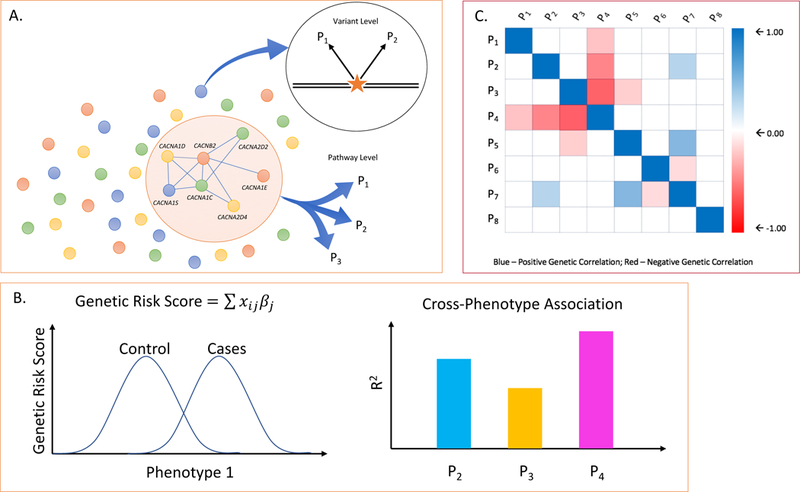
Figure 1. Methods commonly used to evaluate genetic overlap between phenotypes.

A. At the DNA variant level, individual loci (e.g. SNPs, rare mutations, or CNVs) may show evidence of pleiotropic association with two (e.g. P1, P2) or more phenotypes. At the level of biological pathways, gene sets assigned to a pathway may be enriched in association signals beyond chance expectation across multiple phenotype (e.g. P1, P2, P3). B. Genetic risk scores (or polygenic risk scores, PRS) are developed in a “discovery“ GWAS sample and computed for each individual in an independent “target” sample. The genetic risk score for each individual (i) in the target sample is computed as the product of the number of risk alleles (X) at each SNP (j) multiplied by that SNP’s association effect size (βj) and summing over all SNPs. The left hand plot shows the distribution of genetic risk scores in cases and controls in an independent target set for the same phenotype as that of the discovery sample. To examine cross-phenotype overlap, the discovery risk score is applied to target samples of other phenotypes. The proportion of variance explained by the discovery GWAS (R2) for each target phenotype (e.g. P2, P3, P4). is shown in the plot on the right hand side. C. Genetic correlation between phenotypes (ranging from −1.0 to +1.0) can be estimated using multiple methods that compare genetic and phenotypic similarity among unrelated individuals. The figure shows a hypothetical genetic correlation matrix between multiple pairs of phenotypes (P1 – P8).
