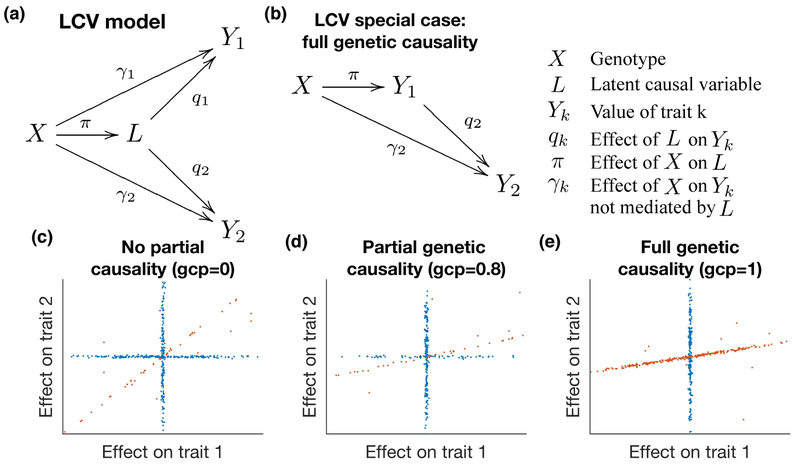
Figure 1:
Illustration of the latent causal variable model. We display the relationship between genotypes X, latent causal variable L and trait values Y1 and Y2. (a) Full LCV model. The genetic correlation between traits Y1 and Y2 is mediated by L, which has normalized effects q1 and q2 on each trait. (See Supplementary Table 17 for a list of random variables vs. parameters.) (b) When q1 = 1, Y1 is perfectly genetically correlated with L (so L does not need to be shown in the diagram), and we say that Y1 is fully genetically causal for Y2. (c) Example genetic architecture of genetically correlated traits with no genetic causality (gcp = 0, i.e. q2 = q1 < 1). Slight noise is added to SNP effects for illustration. Orange SNPs have correlated effects on both traits via L, while blue SNPs do not. (d) Example genetic architecture of genetically correlated traits with partial genetic causality (gcp = 0.8, i.e. q2 < q1 < 1). (e) Example genetic architecture of genetically correlated traits with full genetic causality (gcp = 1, i.e. q2 < q1 = 1).

