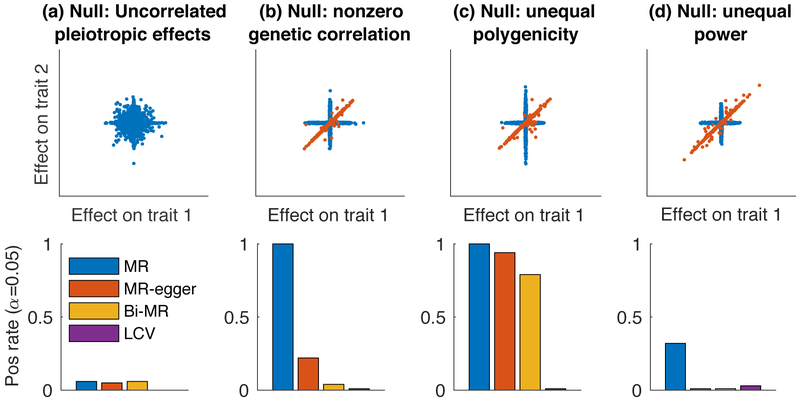
Figure 2:
Null simulations with no LD to assess calibration. We compared LCV to three main MR methods (two-sample MR, MR-Egger and Bidirectional MR). We report the positive rate (α = 0.05) for a causal (or partially causal) effect. Scatterplots illustrate the bivariate effect size distribution. (a) Null simulation (gcp=0) with uncorrelated pleiotropic effects and zero genetic correlation. (b) Null simulation with nonzero genetic correlation. (c) Null simulation with nonzero genetic correlation and differential polygenicity between the two traits. (d) Null simulation with nonzero genetic correlation and differential power for the two traits. Results for each panel are based on 4000 simulations. Numerical results are reported in Supplementary Table 1.

