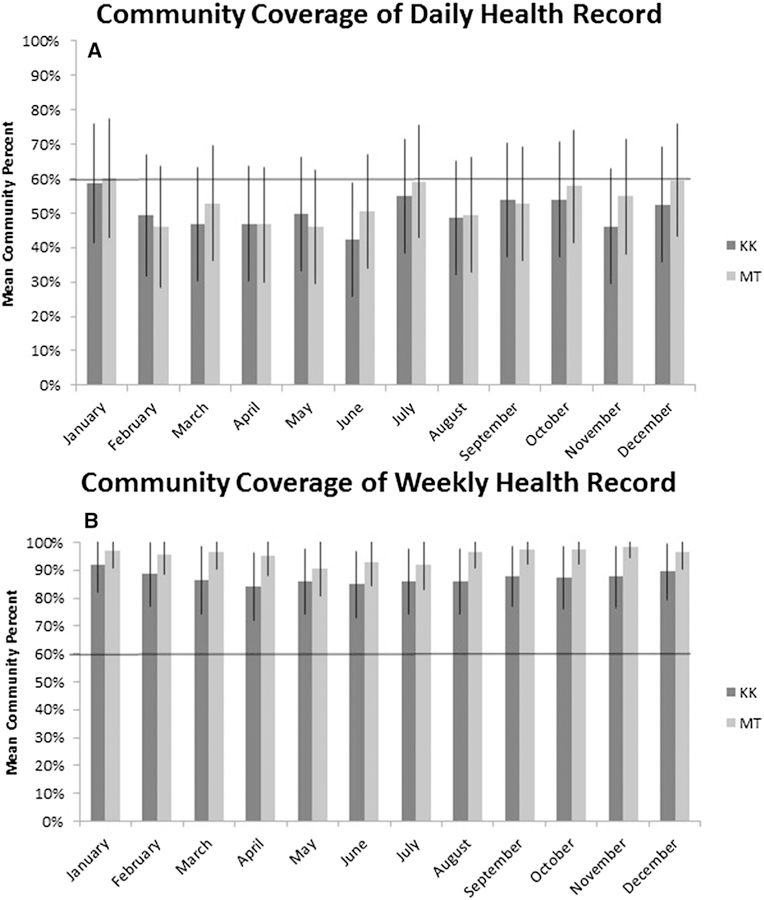
Fig. 1.

Mean community coverage across months. Panel A shows coverage of each community by the Daily Health Record for each month, whereas Panel B shows mean coverage by the Weekly Health Record for each month. The solid black horizontal lines indicate the projected goal of 60% coverage. KK Kasekela community; MT Mitumba community.
