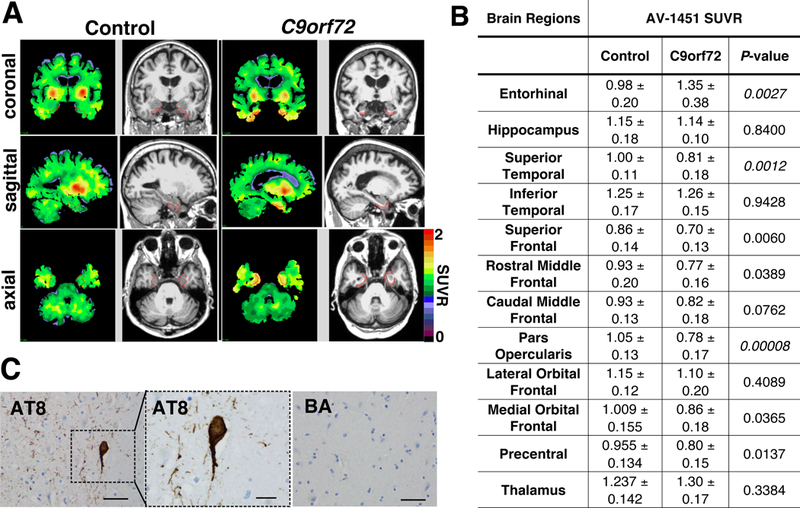
Figure 1.

Tau PET uptake in C9orf72 expansion carriers and controls. A) Representative coronal, sagittal, and axial images showing regional distribution of cerebellar gray-normalized AV-1451 SUVR values and paired T2-weighted MRI images in C9orf72 expansion (right) and control participants (left). Entorhinal cortex is outlined in red. B) AV-1451 SUVR values in twelve brain regions. Statistics by student’s t-test using a Bonferroni significance level of 0.0042. C) Post-mortem analysis of hippocampus from a C9orf72 participant with tau PET SUVR of 1.26. Sections stained with AT8 antibody show tau reactivity (scale bar: 50 μm) in the entorhinal cortex. Inset shows tau pathology at higher magnification (scale bar: 20 μm). Entorhinal cortical sections stained for β-amyloid (BA) did not display reactivity (scale bar: 50 μm).
