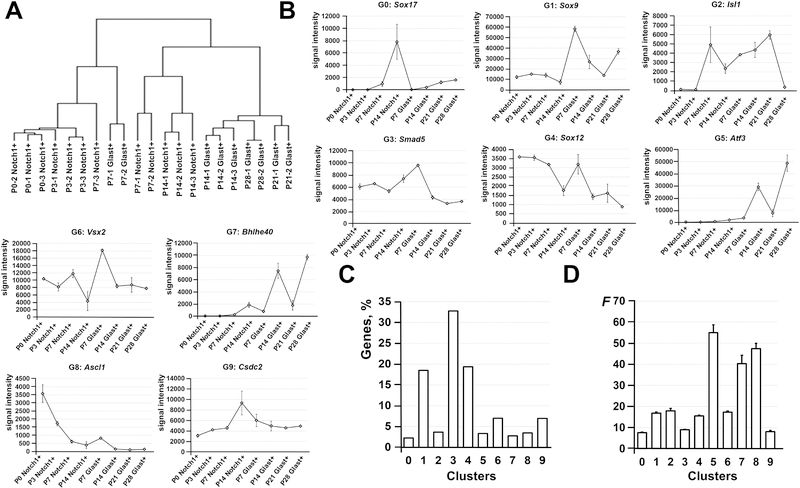
Figure 3.
The results of the hierarchical and k-means clustering revealed the changes that are undergone in RPCs (Notch1+ cells) and Müller glia (Glast+ cells) during retinal development. A) Hierarchical clustering of differentially expressed genes showed that many P7 and P14 Notch1+ cells (late RPCs) are predisposed to become Müller glia. While Glast+ cells at P7 are still very close to a multipotent progenitor state, P14, P21, and P28 Glast+ cells are already grouped together indicating the adult Müller glia state. B) The 10 clusters were identified by the k-means clustering algorithm. C) The majority of differentially expressed genes were located in cluster 1, 3, and 4. D) Meanwhile, significant changes were undergone in genes located in small clusters 5, 7, and 8. A value F (F statistic) was calculated using the ANOVA test.

