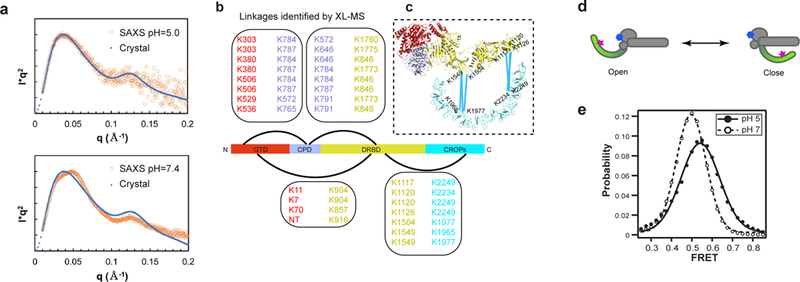
Figure 3.

The CROPs undergoes pH-dependent conformational changes. (a) Curve-fit analysis in SAXS studies. The theoretical Kratky plot based on the structure of TcdB holotoxin agreed with the experimental scattering profile at pH 5.0 (upper panel), but differed from that at pH 7.4 (lower panel). (b) Cross-linked peptides between different TcdB domains were identified by XL-MS. (c) The XL-MS results suggest that TcdB could sample a closed conformation at neutral pH, where the central portion and the C-terminal tip of the CROPs move within ~30 Å of the DRBD. (d) A model of the two limiting structure states of TcdB holotoxin. The acceptor dye on the GTD-bound 7F and the donor dye on the CROPs-bound B39 are shown as a blue hexagon and a red star, respectively. (e) Population histogram of unaveraged FRET efficiency from TcdB in complex with dye-labeled VHHs at pH 5.0 (n = 498) and pH 7.0 (n = 594).
