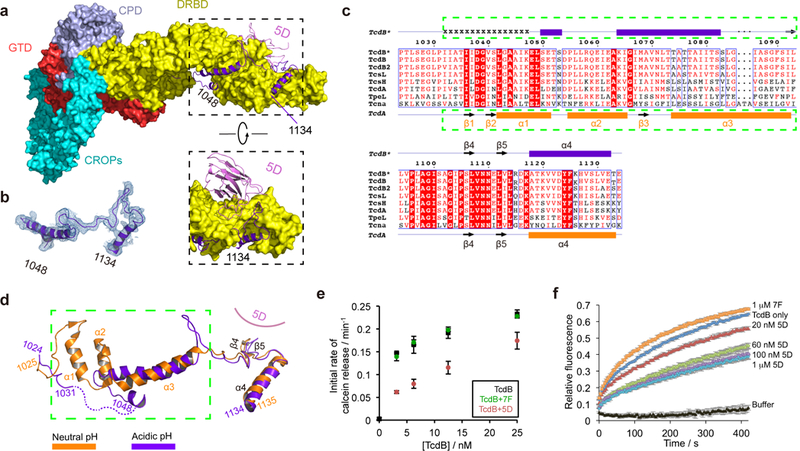
Figure 4.

TcdB displays a novel conformation in the pore-forming region at endosomal pH. (a) 5D binds to the DRBD and directly interacts with the pore-forming region. The pore-forming region of TcdB is shown in a purple ribbon model while the rest of the toxin is shown in a surface model. (b) A representative 2Fo-Fc electron density map of a portion of the pore-forming region (residues 1048–1134) contoured at 1.0 σ, which was overlaid with the final refined model. (c) Amino acid sequence alignment of the pore-forming region among different members in the LCGT family. TcdB*, TcdB, and TcdB2 are produced by the M68 strain, the VPI 10463 strain, and the BI/NAP1/027 strain, respectively. Secondary structures of TcdB* and TcdA 24 are shown on the top and the bottom, respectively. Residues 1032–1047 in TcdB* holotoxin that have no visible electron density are indicated by “x”. (d) TcdB at acidic pH (purple) and TcdA at neutral pH (orange) adopt drastically different conformations in the pore-forming region. The two structures were superimposed based on the DRBD. (e) Calcein dye release assay. TcdB (0–25 nM) was tested with liposomes loaded with 50 mM calcein at pH 4.6, in the presence or absence of 5D or 7F. The rate of calcein dye release was determined based on the increase of fluorescence at 525 nm during excitation at 493 nm. (f) Membrane depolarization assay. Liposomes were polarized at a positive internal voltage by adding valinomycin in the presence of a transmembrane KCl gradient. Membrane potential was measured using the voltage-sensitive fluorescence dye ANS (8-anilinonaphthalene-1-sulfonic acid). After 3 min, TcdB with various concentrations of 5D or 7F was added. The data in (e–f) are presented as mean ± SEM, n=3 independent experiments.
