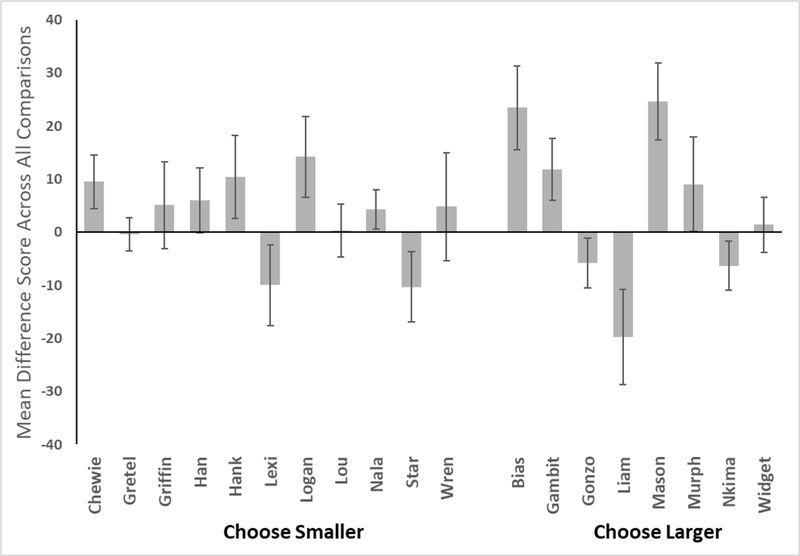
Figure 8.

Mean difference scores across all quantity comparisons for each monkey. These scores are calculated as the percentage of trials correct when the smaller array was at left minus the percentage of trials correct when the smaller array was at right. Error bars indicate 95% CIs.
