
Fig. 4.
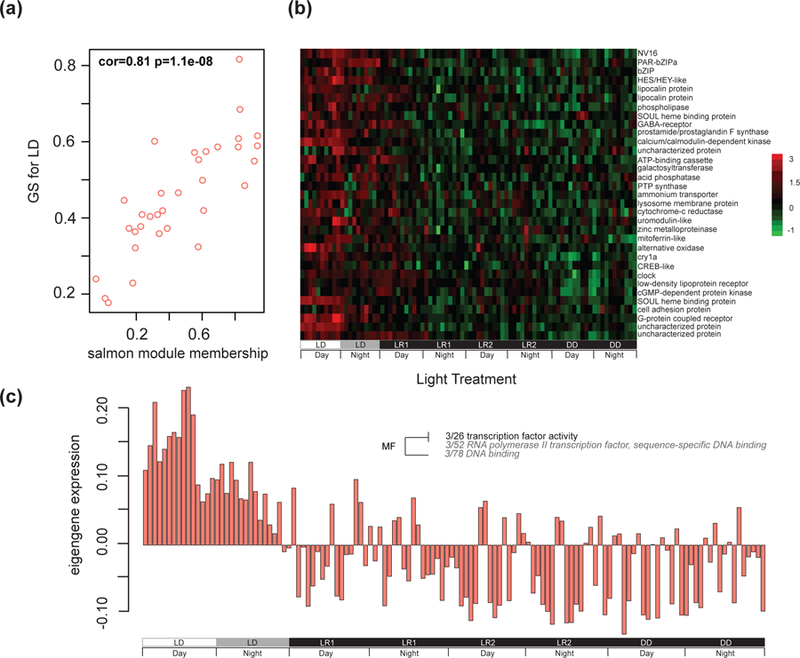
Eigengene expression across all treatment subgroups for light responsive WGCNA salmon module. (A) Scatterplot of the salmon module contains genes co-expressed and positively correlated with light:dark conditions determined by WGCNA analysis and illustrates the genes module membership score along the x-axis and the gene’s significance (GS) for the light treatment trait along the y-axis. A high correlation (cor = 0.81) between these measures indicates a strong association of the module with the trait (i.e. genes in the salmon module are strongly associated with light:dark conditions). (B) Heatmap of genes in the salmon module across each treatment subgroup. The experiment key at the bottom identifies the subgroups and the ‘day’ and ‘night’ periods of each 24-hour cycle. Each row of the heatmap represents a single annotated gene, and each column represents a single individual in each time point (n = 4 per time point). The color scale is log2 fold change. (C) Eigengene expression across all treatment subgroups and long-term darkness with corresponding Gene Ontology. Each bar represents a single individual. The experiment key at the bottom identifies the subgroups and the ‘day’ and ‘night’ periods of each 24-hour cycle. Positive eigengene expression values indicate positive correlation and negative eigengene expression values indicate negative correlation of the module to the light treatment trait. A fisher’s exact test was used to identify significantly enriched GO terms (presence or absence) of the eigengene and categories enriched for molecular function (MF) were assigned. The size and color of the font increases as significance increases, as shown in the inset.